August 13, 2026
·
Updated October 28, 2026
·
14 min read
Google Search Console Not Showing Data? 7 Mistakes to Fix
This troubleshooter covers the seven ways Search Console data most often gets hidden: the property you open, the filters and search type you leave on, the privacy and row limits Google applies, and how average position and date comparisons are calculated. Each mistake comes with how to spot it and how to fix it, based on Google's Search Console documentation as of October 2026.

When Google Search Console isn't showing data, the data usually exists but is out of view. You're looking at the wrong property or search type, a filter is still on, or the rows you want fall under Google's privacy and row limits. Real data loss is rare, and Google records known reporting incidents on its data anomalies page.
Start by naming exactly what's missing: everything, some queries, one page, or a trend that looks wrong. Each symptom points to a different cause, and the table and decision tree below send you to the right fix. If you need a refresher on what each Search Console report shows, read that first.
What’s Missing? Match the Symptom to the Cause
“No data” can mean several different things, and each one has a different cause. Find your symptom, run the first check, and jump to the matching mistake.
| Symptom | Most likely cause | Check first | Go to |
|---|---|---|---|
| The report is empty or nearly empty | Wrong property, or a new one | Does the property’s protocol, www and subdomain match your live URLs? | Mistake 1 |
| Totals dropped the moment you clicked something | A filter, often added by clicking a table row | Filter bar at the top of the report | Mistake 2 |
| Image, video or Lens traffic is missing | Search type is set to Web, or the wrong Web type | Search type filter | Mistake 3 |
| Query rows add up to far less than the total | Anonymized queries | Chart total minus the sum of query rows | Mistake 4 |
| Long-tail queries or pages are missing on a big site | 1,000-row table limit and row truncation | Row count in the table or export | Mistake 5 |
| Position “got worse” while traffic grew | Average position blends many searches | Position per query, country and device | Mistake 6 |
| A sudden drop in the last few days, or year over year | Preliminary data, mismatched ranges or a logged anomaly | Date range and Google’s data anomalies page | Mistake 7 |
| One page shows nothing | Credit goes to another canonical URL, or the page isn’t indexed | URL Inspection | Indexing and canonicals |
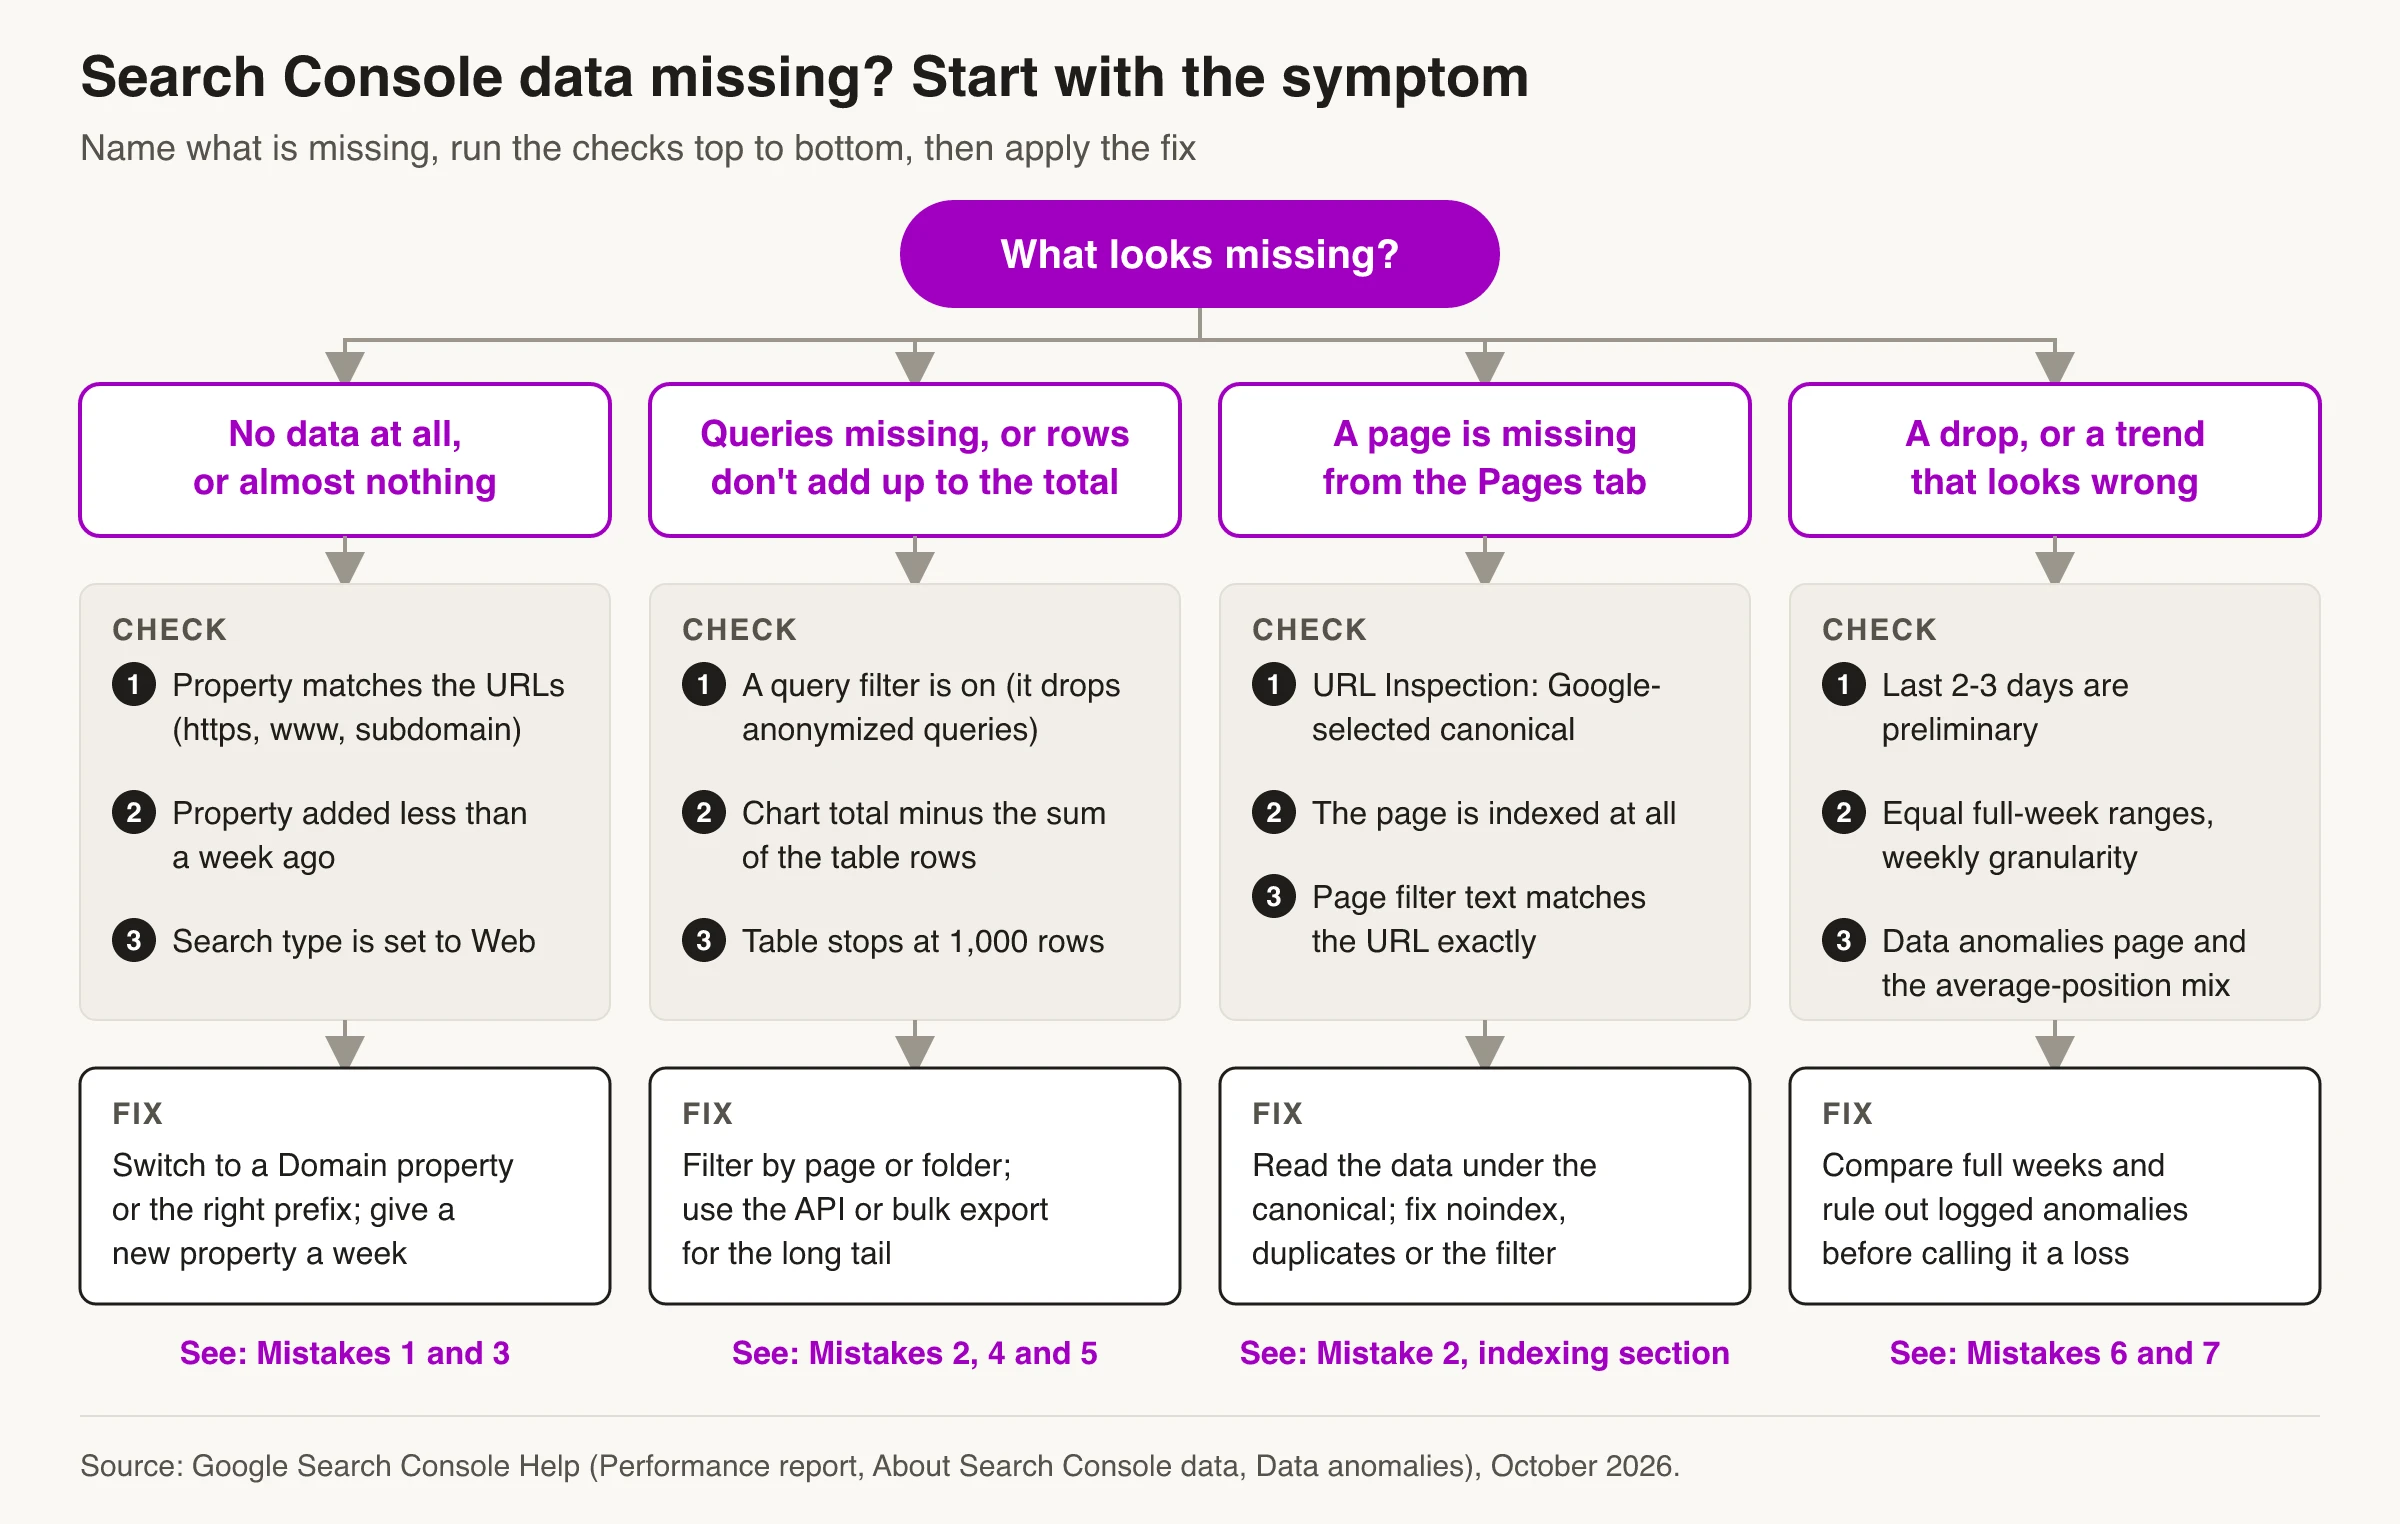
Before you troubleshoot your own setup, open Google’s Data anomalies in Search Console page. It records known logging errors and reporting changes from the last 3 to 16 months. If your dip lines up with a listed date, the problem isn’t your site.
Mistake 1: Checking the Wrong Property
Search Console only shows data for URLs inside the property you’re viewing, and the two website property types draw that boundary very differently. According to Google’s property documentation:
- A URL-prefix property includes only URLs that start with that exact prefix, protocol included.
http://example.com/doesn’t includehttps://example.com/orhttp://www.example.com/, and a prefix such ashttps://example.com/blog/covers only that folder. - A Domain property (
example.com) includes every subdomain and protocol: www, m., http and https. It can only be verified through DNS.
So if your site moved to HTTPS, dropped www, or runs its blog on a subdomain, an old URL-prefix property can look nearly empty while the traffic is fine.
How to tell: open the Pages tab and look at the URLs. If they don’t match the protocol and host your site uses today, you’re in the wrong property. A brand-new property is a separate case: Google says it can take up to a week to generate data for a newly added site, and the first thing it suggests checking after that is the protocol.
Fix: add and verify a Domain property and treat it as the source of truth. Set it up before you start a technical SEO audit, so the audit sees every host and protocol. Keep URL-prefix properties only for sections you want to report on separately, such as a country folder. The Search Console setup guide walks through property choice, DNS verification and user access.
Mistake 2: Leaving Filters On (and Misreading Filtered Totals)
The date range and search type filters are always present and can’t be removed. Everything else in the filter bar is optional, and it’s easy to add without noticing: clicking any row in the table filters the whole report to that row. One stray country, device or page filter turns a sitewide view into a small slice that still looks like a believable chart.
Filters also change the totals in ways that look like missing data, even when you set them on purpose:
- A query filter removes anonymized queries from the totals. Without a query filter, the chart includes them. Add any query filter and they drop out, so totals fall at once.
- “Containing” plus “not containing” won’t add up to the total. Google’s own worked example shows 550 total clicks, but 175 for queries containing a word plus 275 for queries not containing it, which is only 450. The other 100 came from anonymized queries.
- Page and search appearance filters switch counting to per page. One search that shows three of your URLs is one impression for the property but three by page, so totals can rise when you add one of these filters (Google’s discrepancy notes).
- “Containing” matches literally. It isn’t case-sensitive but is otherwise exact, spaces included:
seo auditwon’t match “seo site audit”, and a page filter for/blog/guidealso catches/blog/guides-2026.
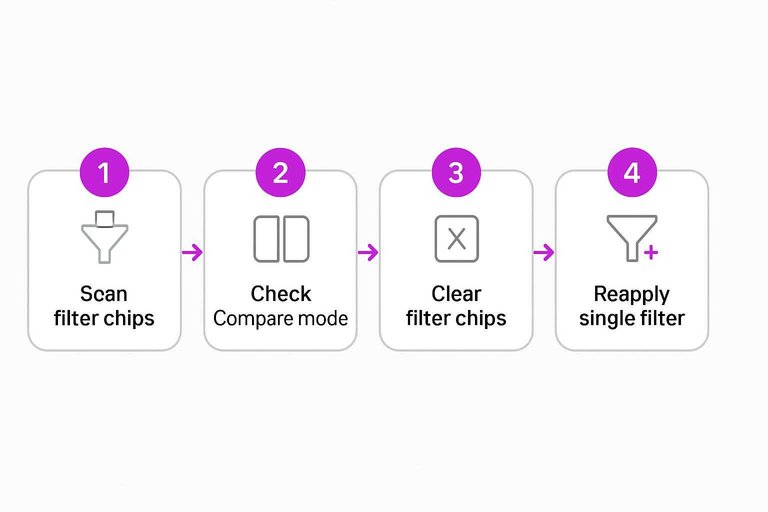
Fix: clear every optional filter, confirm the search type, and write down the clean totals for clicks and impressions. Then add one filter at a time and watch what changes. A report URL someone sends you can carry their filters in its parameters, so reset that view too. Once the view is clean, here’s how to check keyword rankings on Google query by query.
Mistake 3: Ignoring the Search Type
The Performance report opens on the Web search type, and each search type is counted separately. Google says data is recorded for each search type separately and not combined, even when the same image appears in both web results and the Images tab. The search types are:
| Search type | What it covers | Easy to miss when |
|---|---|---|
| Web: text-based | Typed searches in the standard Google search bar | Rarely; it’s the default view |
| Web: multimodal | Searches with images: Google Lens, Circle to Search, uploaded images, Chrome image search | You look for queries; this type has no Queries dimension |
| Image | Results in the Google Images tab | You run a recipe, product or photo site |
| Video | Results in the Videos tab | You publish video pages |
| News | The News tab and news search results view | You’re a publisher |
Discover and Google News have separate Performance reports, which appear once a site gets enough traffic there, so that traffic never shows up under Search results.
AI features are the opposite case. Impressions and clicks from AI Overviews and AI Mode are already inside the Web search type. The separate generative AI performance report isolates the impressions but has no clicks or queries. If it doesn’t appear for your site, Google gives two usual reasons: too few impressions in AI features, or the site has been excluded from Search generative AI features.
Fix: match the search type to your question before you read any number. To see where traffic comes from, open the search type filter and choose Compare: you can put two search types side by side.
Mistake 4: Expecting Anonymized Queries to Show Up
Google leaves some queries out of the query table to protect searchers’ privacy. In the same 2022 Search Central blog post, Google defines anonymized queries as those “that aren’t issued by more than a few dozen users over a two-to-three month period.” Queries that could contain personal or sensitive information are also left out. Their clicks and impressions still count in the chart totals, unless you add a query filter.
For many sites this is a large share of traffic. Ahrefs’ February 2026 study of 887,534 Search Console properties found that anonymized queries accounted for 46.77% of clicks in April 2025 data, up from 45.02% in April 2024. Ahrefs also found the share varies widely from site to site, so measure your own.
How to tell: export the Queries table and add up the clicks, then compare the sum with the chart total for the same dates and search type. The gap is clicks from queries you can’t see. Part of it is anonymized queries, and on large sites part of it is row truncation (Mistake 5), so don’t label the whole gap as anonymized.
Fix: there’s no setting that reveals anonymized queries. The API doesn’t return them either, and the BigQuery bulk export only marks those rows as anonymized, with the query text left empty. Work around them instead:
- Judge pages by their totals on the Pages tab with no query filter. Those totals don’t depend on the query being visible.
- Read the visible queries as a sample of what a page is found for, not a complete list.
- Report the gap itself (total clicks minus itemized clicks) so stakeholders don’t assume the table is everything.
Mistake 5: Treating the 1,000-Row Table as the Full List
Performance tables show at most 1,000 rows, and the export button exports at most 1,000. On a site with thousands of pages or queries, everything past row 1,000 is simply not in the table, while it still counts in the chart. Google adds that Search Console stores only the top data rows, so not every query is kept even before the display limit applies.
Your options for getting more rows, per Google’s documentation:
| Method | Row limit | Shows anonymized query text? |
|---|---|---|
| Report table and export | 1,000 rows | No |
| Search Analytics API and the Looker Studio connector | Up to 50,000 rows per day per site per search type (25,000 per request, paginated with startRow) | No |
| Bulk data export to BigQuery | Daily export; Google calls it the most complete list of queries | Rows are flagged as anonymized, but the query text is empty |
Not every view is truncated. Google says views without a query or URL dimension, such as countries, devices and search appearance, display and export all the data.
Fix: for a one-off check, narrow the view so it fits under 1,000 rows: filter to one folder with a page filter, or to one country. For recurring reporting on a large site, pull data through the API one day at a time, or set up the bulk export so the data lands in your own BigQuery project. If you report from this data, build an SEO dashboard that accounts for these limits.
Mistake 6: Misreading Average Position
Average position isn’t your rank today. Google defines it as the topmost position a link to your site held in a search result, averaged across all the searches in which your site appeared. In the chart it’s the average for the whole site; in the table it’s the average for that row’s query, page, country or device. A few rules explain most surprises:
- No impression, no position. If your result sat on page 3 and the searcher only saw page 1, no position is recorded. A dash means no recorded position at all.
- Each result element is one position. An AI Overview takes a single position and every link in it shares that number. A featured snippet typically holds position 1. Ads don’t take a position.
- The same number can mean different things. Google’s own examples for position 11 include the top of a knowledge panel on desktop, the first result on page 2, or a row of image results.
- Your own search won’t match. Results depend on location, device and search history, so a spot check can show a different position than the average.
A common misread is a falling average during growth. When a page starts appearing for new, lower-ranked queries, those impressions pull the average down even though nothing you already had got worse. The same blending is why Search Console position differs from your rank tracker.
One more caveat for long comparisons: when Google stopped supporting the num=100 results parameter in September 2025, many sites saw impressions drop and average position improve with no real ranking change, because impressions generated by rank-tracking crawls stopped being counted (ZEO’s analysis).
Fix: read position per query, filtered to one country and one device, and always next to impressions and CTR. Track the trend for a query you care about rather than the sitewide average.
Worked example: position falls while visibility grows
These figures are illustrative, not from a real site. A page ranks at position 3 for one query and gets 900 impressions a month. The next month it also starts appearing at position 18 for a new related query, with 300 impressions, while the first query holds steady.
| Month 1 | Month 2 | |
|---|---|---|
| Query A: position 3 | 900 impressions | 900 impressions |
| Query B: position 18 | — | 300 impressions |
| Page average position | 3.0 | (3 × 900 + 18 × 300) ÷ 1,200 = 6.75 |
The page-level average went from 3.0 to 6.75, which looks like a drop of almost four places. In fact the page kept its ranking and added 300 impressions. Filter to Query A and you’ll see position 3 in both months.
Mistake 7: Comparing Date Ranges That Don’t Line Up
Many “sudden drops” in Search Console are comparison problems. Google documents several reasons two date ranges aren’t directly comparable:
- Recent data is incomplete. Collected data is usually available in two to three days, and the newest data is preliminary, drawn as a dotted line. A window that ends yesterday will undercount the last days.
- Days are Pacific Time. Every view except the 24-hour view labels days in Pacific Time, so daily numbers won’t line up with tools that use your local time zone.
- Day of the week matters. Google recommends weekly or monthly granularity when comparing ranges, so you don’t compare a Monday with a Saturday. Weeks run Sunday to Saturday, and a range that starts midweek has a partial first and last week.
- Rare rows show “~” in comparisons. If a value is very rare in one period but not the other, the rare side shows “~” (not available) instead of a number. Filter to that value to see both.
- History stops at 16 months. Anything older is gone from the report unless you exported it.
Logged changes matter just as much in 2026. Google’s data anomalies page records a logging error that affected impression reporting from May 13, 2025, which Google says was resolved in April 2026. After the fix, you may see a decrease in impressions. Only impressions and the metrics built on them, CTR and average position, were affected; clicks weren’t. The same page notes that FAQ rich results stopped appearing on May 7, 2026, so FAQ impressions fell for that reason alone. Add the num=100 change from September 2025 (Mistake 6), and a year-over-year impressions comparison made in late 2026 can show a decline that isn’t a ranking loss.
Fix: compare equal-length ranges made of full weeks, leave out the last three days, and switch to weekly granularity. For year-over-year work, lean on clicks rather than impressions, CTR or average position across the logged windows. Annotate the chart when you ship a release or a migration so the next shift has context. If clicks still fell once the ranges line up, work through this CTR-drop triage.
When Data Really Is Missing: Indexing and Canonicals
If you’ve cleared all seven mistakes and one page still shows nothing, the cause is usually on the site, not in the report.
The credit goes to a different canonical URL
Search Console assigns clicks, impressions and position to the canonical URL Google selected, not necessarily the URL you’re tracking. When someone clicks a duplicate URL in the results, the click counts toward the canonical. The Pages dimension also reports the final URL a result linked to, after any redirects. So if Google chose /pricing/ over /pricing, or a parameter version, your target URL can look empty while its data sits under another row.
To check, run URL Inspection on the indexed version and compare the user-declared canonical with the Google-selected canonical. Only the indexed data shows Google’s choice; the live test can’t predict it. If they differ, look for the data under Google’s choice. Then make your signals agree: Google lists redirects and rel=“canonical” as strong signals and sitemap inclusion as a weak one, and recommends linking internally to the canonical URL.
The page isn’t indexed
A page Google hasn’t indexed can’t earn impressions, so the Performance report has nothing to show. URL Inspection tells you whether the URL is on Google. If it isn’t, the reason (noindex, robots.txt, a redirect, a duplicate, or “Crawled - currently not indexed”) decides the fix, and the guide to CMS pages that aren’t getting indexed works through each status.
The reverse is normal too. An indexed page with zero impressions usually means nobody searched for what it covers during that period. That’s a content or demand question, not a reporting gap.
A 10-Minute Search Console Data Check
- Check for anomalies. Compare your dip with Google’s data anomalies page.
- Confirm the property. Use the Domain property, or a URL-prefix property that matches today’s protocol and host.
- Reset the view. Clear optional filters, set the search type, and note the clean totals.
- Measure the hidden share. Chart total minus the sum of exported query rows.
- Check the row count. If a table hits 1,000 rows, narrow it or move to the API or bulk export.
- Read position narrowly. One query, one country, one device, next to impressions.
- Compare fairly. Equal full weeks, the last three days excluded, weekly granularity.
- Inspect the URL. Confirm it’s indexed and see which canonical Google selected.
To compare Search Console with your on-site analytics afterwards, connect Search Console to GA4 and compare trends rather than totals. For how these checks fit into a wider SEO process, see Skribra’s SEO guide.
Frequently Asked Questions
- Why is Google Search Console not showing any data?
- The most common reasons are a property that doesn't match your URLs (for example http instead of https, or www vs non-www), a property added less than a week ago, or filters and a search type that hide the traffic. If the property is right and a week has passed, check whether your pages are indexed and actually getting impressions.
- Why don't my Search Console query rows add up to the total?
- The chart total includes clicks from anonymized queries, which Google never lists as rows, and on large sites some rows fall beyond the 1,000-row table limit. Subtract the sum of the visible rows from the chart total to see how much traffic comes from queries you can't see.
- Can I see anonymized queries anywhere?
- No. Google doesn't reveal their text in the Performance report, the Search Analytics API or the BigQuery bulk export, which marks those rows as anonymized with an empty query field. You can still measure their share of clicks, and page-level totals without a query filter include that traffic.
- How do I get more than 1,000 rows from Search Console?
- Use the Search Analytics API or the Looker Studio connector, which can return up to 50,000 rows per day per site per search type, or set up the bulk data export to BigQuery for the most complete data. For a quick check in the interface, filter to one folder or country so the view fits under 1,000 rows.
- Why did my average position get worse when traffic went up?
- Average position is averaged across every impression. When a page starts showing for new, lower-ranked queries, those impressions pull the average down even if your existing rankings didn't change. Filter to a single query, country and device to see the real movement.
- Why are my impressions lower than last year?
- Check Google's data anomalies page first. A logging error affected impression reporting (and with it CTR and average position) from May 2025 until it was fixed in April 2026, FAQ rich results stopped appearing in May 2026, and the num=100 change in September 2025 cut deep-page impressions for many sites. Compare clicks over equal full weeks before treating it as a ranking loss.
See Search Console Data for Every Article
Skribra connects to Google Search Console and shows clicks, impressions, CTR, average position and indexing status for each article it publishes, with up to 16 months of history backfilled when you connect. It reads the same Search Console data, so the privacy and row limits above still apply, but you see each article on its own instead of digging through filters.
Plans start at $19/month, and every plan comes with a 3-day free trial.
Written by
Skribra
This article was crafted with AI-powered content generation. Skribra creates SEO-optimized articles that rank.
Share: