October 14, 2026
·
Updated October 28, 2026
·
18 min read
SEO KPIs: 9 Content Marketing Metrics and a 2026 Dashboard
A practical guide to nine SEO KPIs for content programs, with the Search Console or GA4 report behind each one and a four-page SEO dashboard you can build in Data Studio, the tool Google called Looker Studio until April 2026.

SEO KPIs are the few search metrics you have agreed will decide what happens to your content: publish more, fix, refresh or stop. For a content program in 2026, the nine worth tracking are indexed rate, non-branded impressions, AI feature impressions, non-branded clicks, CTR against your own position baseline, organic engagement rate, organic key event rate, content ROI and the share of pages that are decaying.
Eight of the nine come straight from Google Search Console and GA4; content ROI also needs your costs. Below: each KPI's source, formula and decision, then a Data Studio dashboard build, a diagnosis table and a worked ROI example.
SEO KPIs vs. SEO metrics: what belongs on the list
Search Console and GA4 give you dozens of metrics. One earns a place as a KPI when it maps to a stage of how content earns value, you can compute it the same way every month, and a change in it triggers a specific action. Average position fails the last test on its own: it averages every query a page shows up for, so it can improve while clicks fall.
The nine KPIs follow one chain: a page has to be indexed, seen, clicked, engaged with and converted, and then hold its ground. When a number drops, check the stages to its left first. A conversion problem on a page Google stopped indexing isn’t a conversion problem.
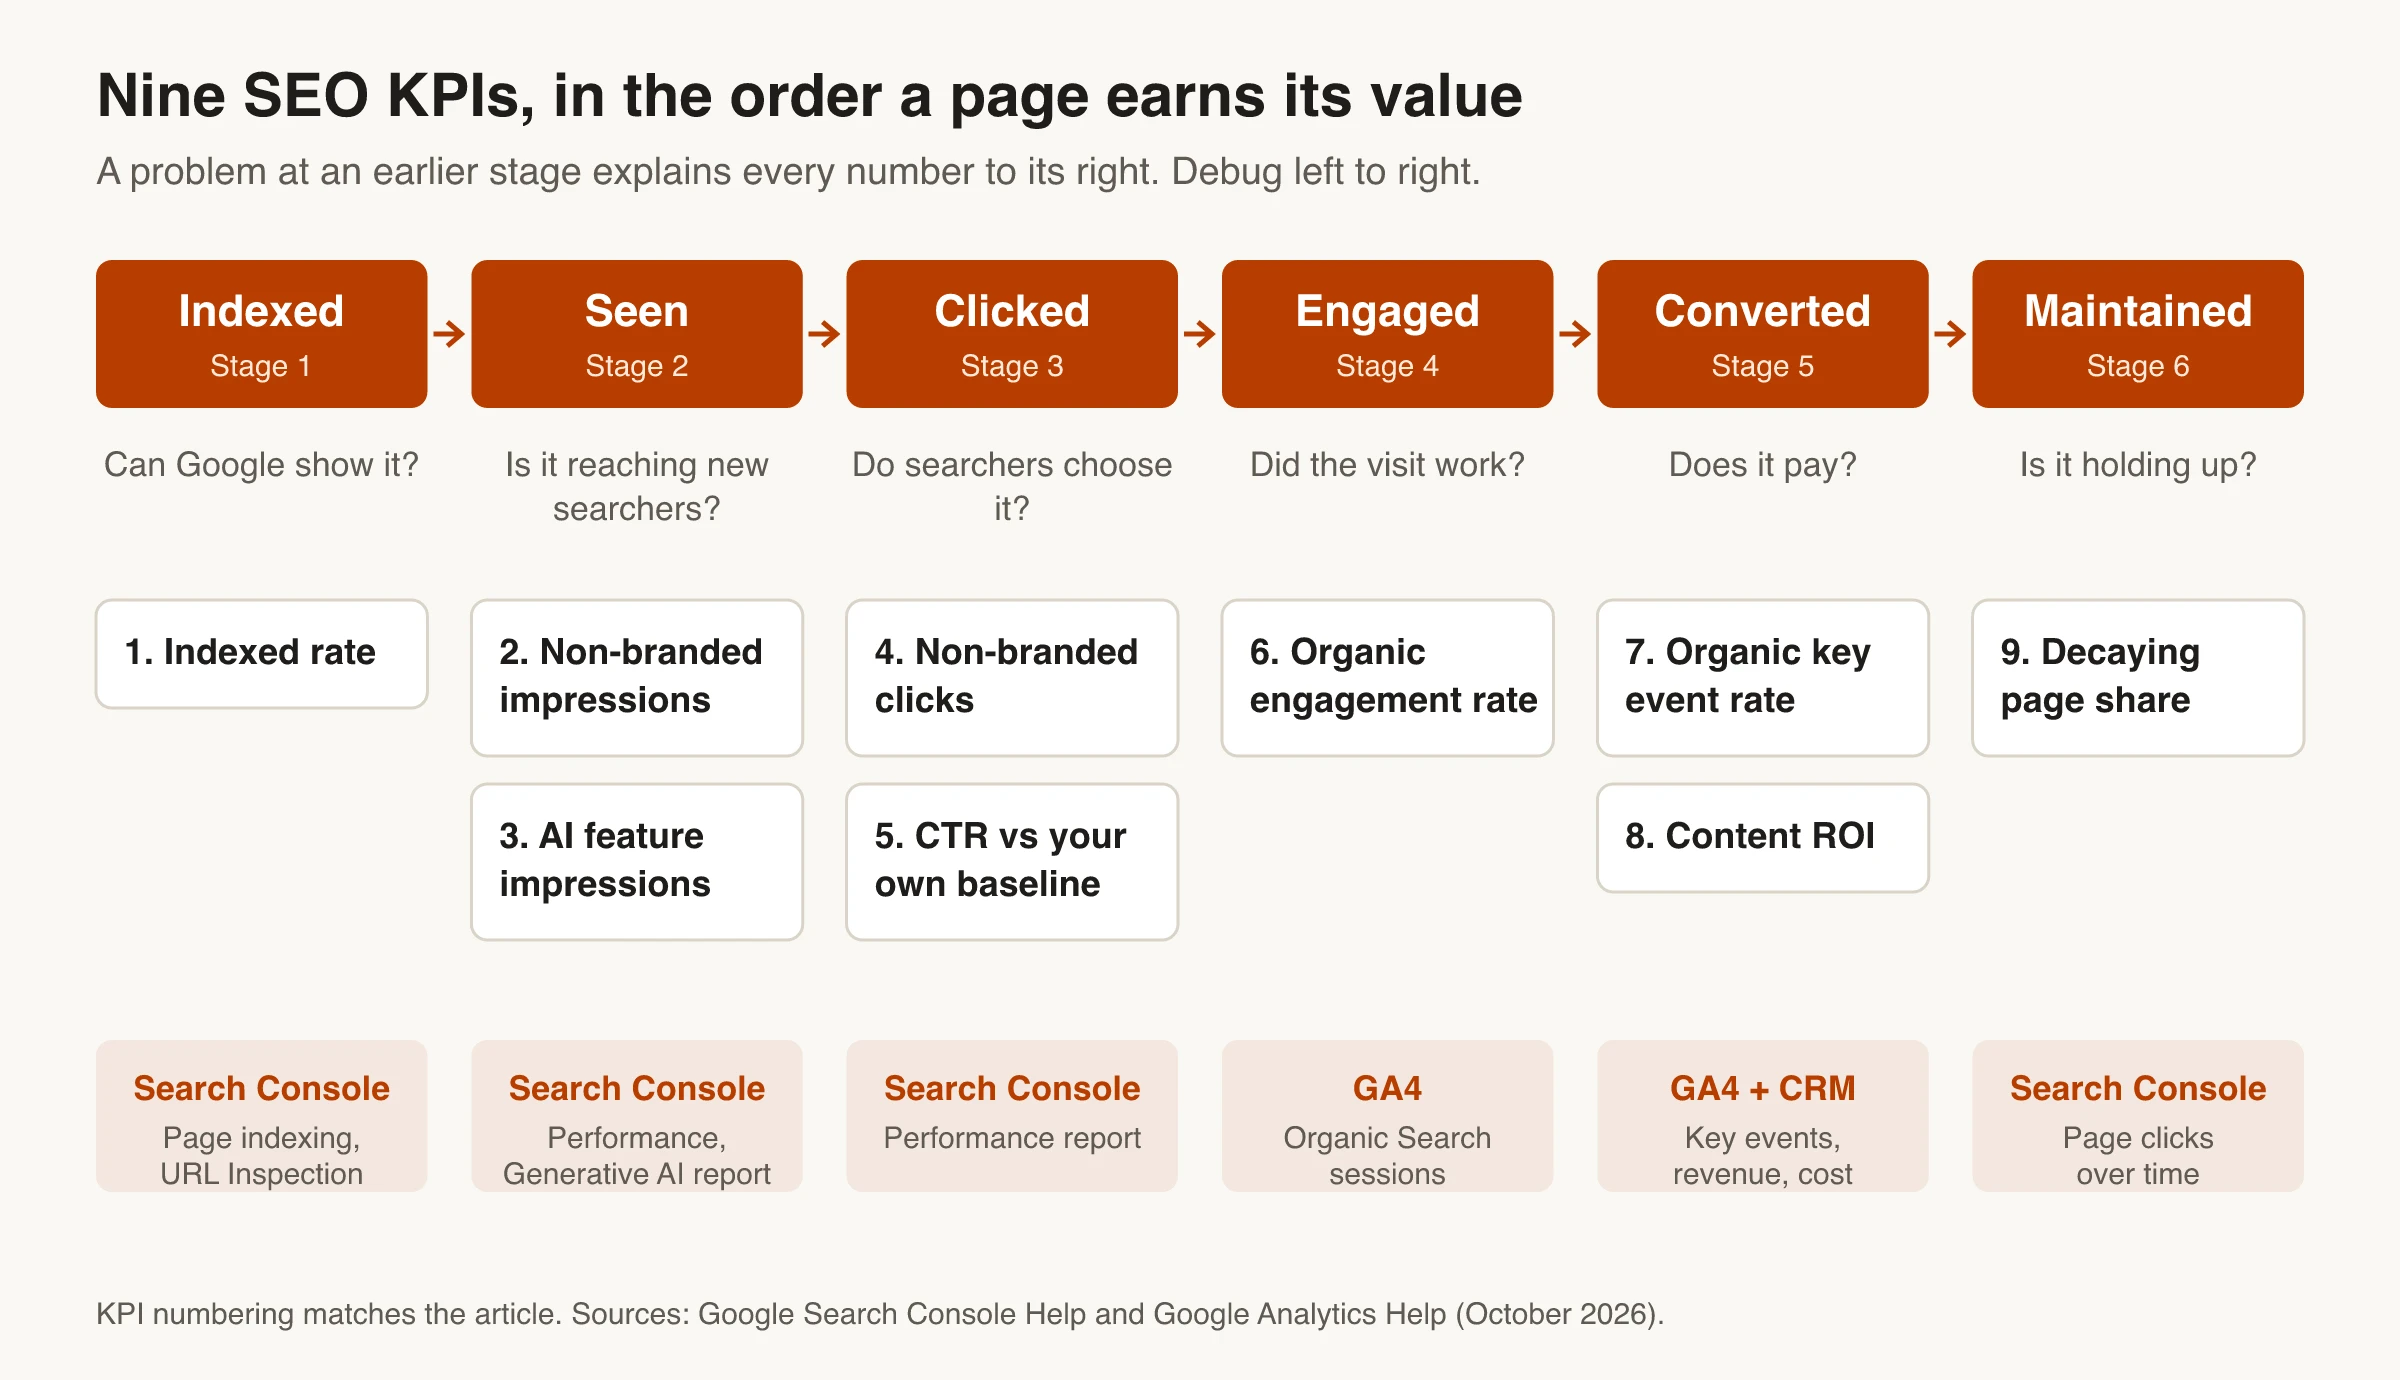
| # | KPI | Formula | Where to get it | Decision it drives |
|---|---|---|---|---|
| 1 | Indexed rate | Indexed published URLs ÷ published URLs | Search Console Page indexing report, URL Inspection | Fix indexing before publishing more |
| 2 | Non-branded impressions | Impressions with the Non-branded query filter | Search Console Performance report | Which clusters reach new searchers |
| 3 | AI feature impressions | Impressions in AI Overviews and AI Mode, by page | Search Console generative AI performance report | Which pages show up in AI answers |
| 4 | Non-branded clicks | Clicks with the Non-branded query filter | Search Console Performance report | Traffic targets and refresh priority |
| 5 | CTR vs. baseline | Page CTR minus your median CTR for the same position band | Search Console Performance export | Which titles and snippets to rewrite |
| 6 | Organic engagement rate | Engaged sessions ÷ sessions, Organic Search | GA4 | Intent mismatch or weak pages |
| 7 | Organic key event rate | Sessions with a key event ÷ sessions, Organic Search | GA4 (Session key event rate) | CTA and conversion-path fixes |
| 8 | Content ROI | (Attributed value − content cost) ÷ content cost | GA4 or CRM, plus your cost records | Budget by cluster |
| 9 | Decaying-page share | Pages with clicks down past your threshold ÷ pages with traffic | Search Console Performance, Pages with Compare | Refresh queue |
This list covers the content program and the business. Results-page measurements such as rank distribution, share of voice and SERP features are in the guide to SERP metrics worth tracking. For how measurement fits into planning and refreshes, see how SEO content marketing works; the SEO guide covers the basics.
The 9 SEO content marketing KPIs, one by one
Report each KPI by topic cluster as well as site-wide: a site total can stay flat while one cluster grows and another collapses.
1. Indexed rate
The share of your published pages that Google has indexed. Nothing else on this list happens without it.
Where to get it: Search Console’s Page indexing report splits known URLs into indexed and not indexed, with a reason for each; use URL Inspection for specific URLs. The report’s example list stops at 1,000 URLs, so on a large site, inspect a sample of your newest posts.
Formula: indexed published URLs ÷ published URLs (from your sitemap or CMS). A cheap dashboard proxy: the share of published URLs with at least one impression in the last 28 days.
Decision: if the rate drops or “Crawled - currently not indexed” keeps growing, pause publishing in that section and fix the cause first. The guide to pages that aren’t getting indexed covers the usual ones.
2. Non-branded impressions
How often your pages appear for searches that don’t include your brand, which shows whether content reaches new people rather than those who already know you.
Where to get it: the Performance report, Query filter, Non-branded. Google’s branded queries filter has been available to all eligible sites since March 11, 2026. An AI-assisted system classifies queries, including misspellings and brand-specific product names. It isn’t offered for URL-path or subdomain properties, or for sites with too little query volume.
Formula: impressions with the Non-branded filter, per cluster and month. Filtered views leave out anonymized queries, so branded plus non-branded can add up to less than the unfiltered total.
Decision: clusters with rising impressions but flat clicks go to KPI 5. Clusters with flat impressions need new or expanded content, not title rewrites.
3. AI feature impressions
How often your pages appear as links inside AI Overviews and AI Mode.
Where to get it: Search Console’s generative AI performance report, launched in June 2026 and rolled out to all sites worldwide as of August 31, 2026. It reports impressions only, by page, country, date and device: no clicks, no queries, and the usual 1,000-row table limit.
Formula: AI feature impressions per page and cluster, per month. Track it next to KPI 2, not added to it. The report draws on the same Web search data as the Performance report, where a click on an AI Overview link already counts as a click and all links in one AI Overview share its position (Google’s metric definitions).
Decision: high AI feature impressions with falling clicks don’t necessarily mean lost demand. Check KPIs 6 and 7 for the visits you still get before cutting or rewriting. An empty report usually means too few impressions, or a site excluded from generative AI features.
4. Non-branded clicks
Visits from Google Search on queries that don’t name your brand: the closest Search Console gets to “new audience reached.”
Where to get it: the Performance report with the Non-branded filter, or the brand-group calculated field from the dashboard section.
Formula: clicks with the Non-branded filter, month over month and year over year (seasonal topics only make sense year over year).
Decision: this is the number to forecast and set targets on. If it falls while non-branded impressions hold, the snippet or results page is the problem (KPI 5). If both fall, check rankings and indexing.
5. CTR against your own baseline
Whether searchers pick your result as often as its position suggests. Raw click-through rate mostly reflects position and query mix.
Where to get it: export the Queries and Pages tables from the Performance report for the last three months, with the Non-branded filter on.
Formula:
- Group non-branded queries into position bands by average position: 1–3, 4–6, 7–10 and 11–20.
- Take the median CTR (clicks ÷ impressions) of the queries in each band. That’s your baseline.
- For each page, CTR gap = the page’s CTR − the baseline for the band its average position falls in.
When you total CTR for a page, cluster or site, divide summed clicks by summed impressions; averaging row-level CTRs gives the wrong number. Bands are easier in a spreadsheet than in Data Studio, where average position is a metric, not a dimension.
Decision: pages with plenty of impressions and the largest negative gap get new titles and meta descriptions first. The list of results-page errors that cut organic CTR covers the usual fixes.
6. Organic engagement rate
Whether organic visits do anything. GA4 counts a session as engaged if it lasts longer than 10 seconds, has a key event, or has two or more page or screen views. Engagement rate is engaged sessions ÷ sessions; bounce rate is the share that weren’t engaged.
Where to get it: a GA4 landing page report or free-form exploration filtered to Session default channel group = Organic Search. Most reports don’t show engagement rate by default; an Editor or Administrator can add it with Customize report.
Formula: engaged sessions ÷ sessions for Organic Search, by landing page and content group.
Decision: a healthy CTR with a low engagement rate usually means the page promises something it doesn’t deliver: fix the opening, match the intent or merge it into a stronger page. Compare pages of the same type only.
7. Organic key event rate
The share of organic sessions that complete an action you care about, such as a sign-up, demo request, purchase or lead form. GA4 calls these key events (formerly conversions). You mark events as key events under Admin > Data display > Events, up to 30 on a standard property.
Where to get it: GA4’s Session key event rate metric, filtered to Organic Search, by landing page. Marking an event only counts from that moment on, with no history, so mark events before you need the numbers.
Formula: sessions with at least one key event ÷ sessions. Track the count too: a rising rate on falling traffic can still mean fewer leads.
Decision: pages with good engagement and a near-zero rate need a clearer next step: a relevant CTA, a product mention where it fits, or an internal link to a commercial page. This is your content’s conversion rate, and where most “blog traffic not converting” problems show up.
8. Content ROI
Whether your content earns more than it costs.
Where to get it: value from GA4 revenue, or key events × a value per lead from your CRM; cost from your own records.
Formula: (attributed value − content cost) ÷ content cost. The ROI section below has the method and a worked example.
Decision: move budget between clusters, not individual posts; single-page ROI is too noisy to act on.
9. Decaying-page share
How much of your library is losing traffic as competitors publish, the results page changes or facts age.
Where to get it: the Performance report, Pages tab, with Compare set to the last 28 days vs. the previous period, or vs. the same period last year for seasonal topics.
Formula: pages whose clicks fell by more than a threshold you set (for example 20%) ÷ pages with at least a minimum number of clicks in the earlier period (for example 20). Both are examples to tune; the minimum keeps tiny pages from flooding the list.
Decision: flagged pages are your refresh queue: update facts, expand thin sections, fix titles, or merge pages competing for the same query. If the share keeps rising, schedule refreshes before new posts.
Search Console and GA4 limits that change your numbers
Both tools filter or expire data in ways that make honest numbers look wrong, so settle these before you set targets. Setup steps are in the guide to SEO tracking in GA4, and the Search Console guide explains every report.
Search Console
- Anonymized queries. Queries that fewer than a few dozen users searched over two to three months are left out of tables and the API but counted in chart totals unless you apply a filter, so query rows never add up to the total (Google’s post on data limits).
- Row limits. The interface exports 1,000 rows. The Search Analytics API and the Data Studio connector go up to 50,000 rows per day per site per search type; the API returns up to 25,000 rows per request, paged with startRow.
- Site vs. page totals. Chart totals and the query, country and device tables are aggregated by property, the Pages table by page, so the views can disagree (Performance report help).
- 16 months of history. To keep more, set up the bulk data export to BigQuery: a daily export of all performance data except anonymized queries, from setup onward. Pull anything older from the API before it ages out.
GA4
- Link Search Console. The Search Console integration adds two reports, Google Organic Search Queries and Google Organic Search Traffic, unpublished by default (publish them from Library). Their metrics combine only with Landing page, Device and Country, data arrives about 48 hours after Search Console collects it, and each web data stream links to only one Search Console property.
- Know what Organic Search includes. In GA4’s default channel group, Organic Search includes visits from Google’s AI Overviews and AI Mode. Visits from assistants like ChatGPT, Gemini, Copilot and Grok go to a separate AI Assistant channel; report it as its own line.
- Group pages into clusters. Content groups use the content_group parameter, set through gtag or Google Tag Manager. Without them, cluster reporting means regex on URLs.
- Check data retention. Standard properties keep event data for 2 or 14 months; 26, 38 and 50 months are GA4 360 only. Retention affects explorations and funnel reports, not standard reports, so choose 14 months if you compare explorations year over year.
How to build an SEO dashboard in Data Studio
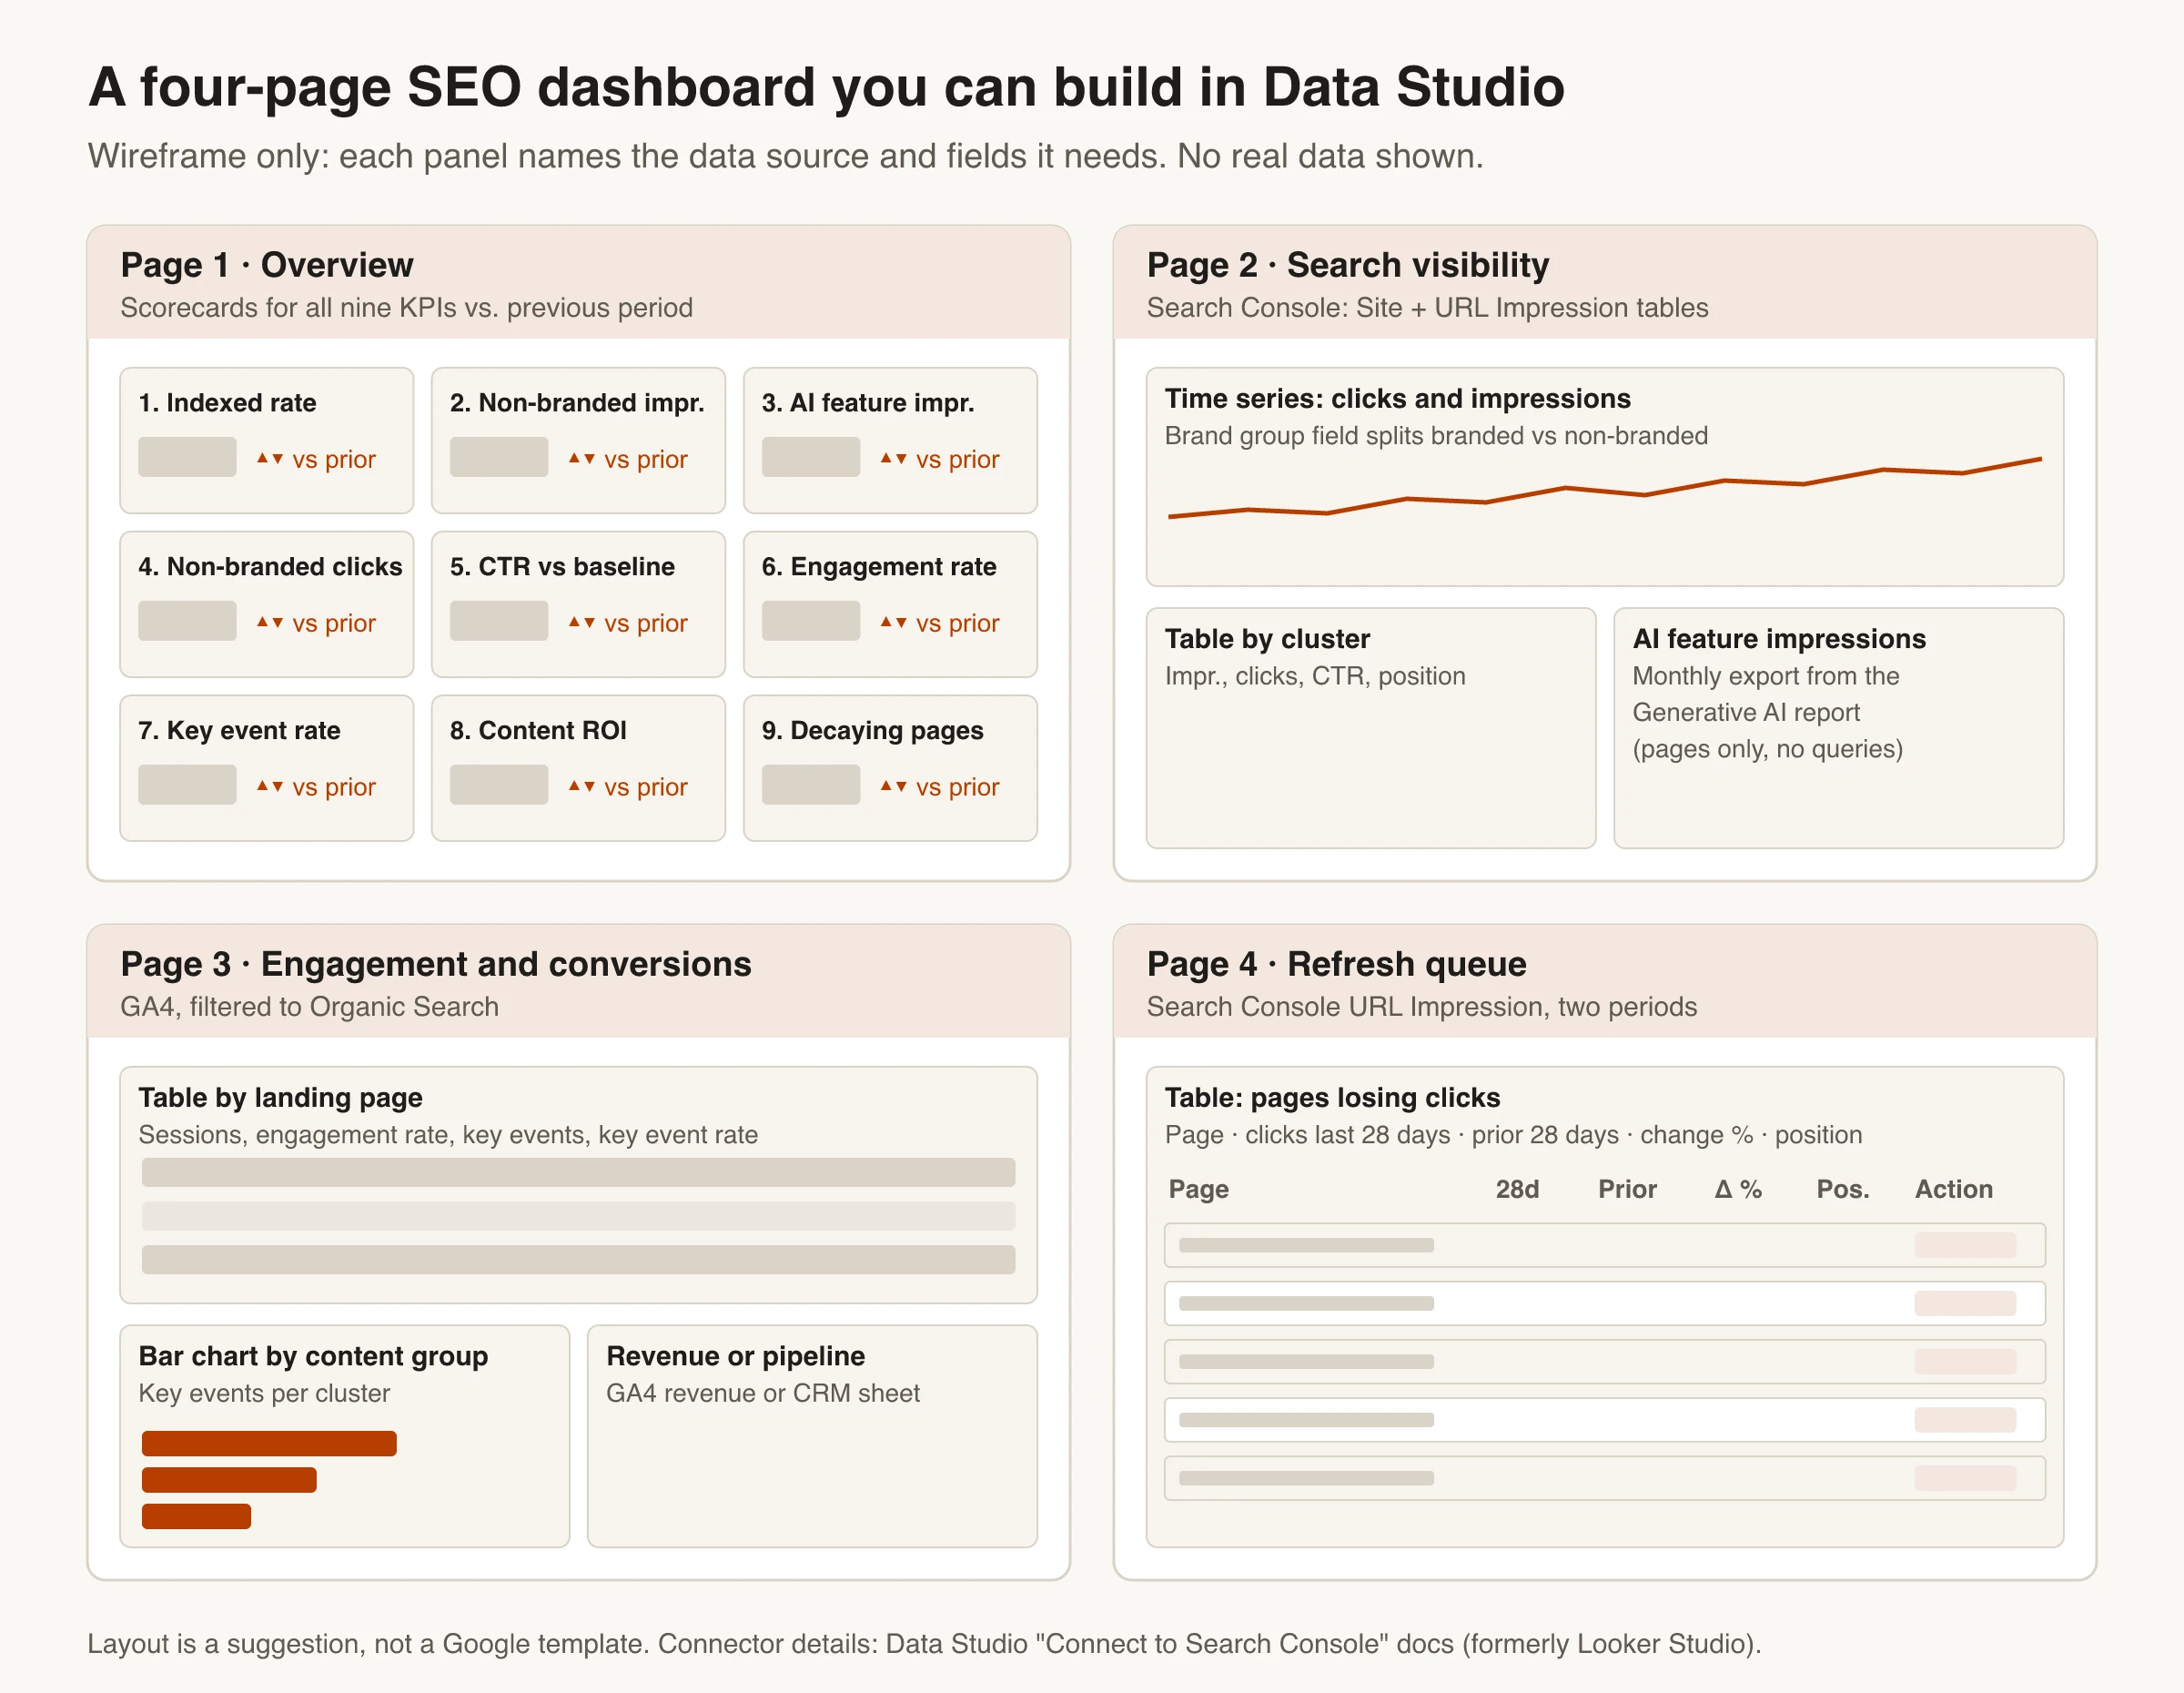
Google renamed Looker Studio to Data Studio on April 16, 2026, according to its release notes. It’s the same product, so tutorials that say Looker Studio still apply. A four-page report covers all nine KPIs.
Step 1: Connect three data sources
- Search Console, Site Impression table: property-level data by query, for branded vs. non-branded totals and site-wide CTR.
- Search Console, URL Impression table: page-level data with the Landing Page dimension, for page and cluster tables and the refresh queue. A data source can use only one of the two tables, so add both (Google’s connector documentation).
- GA4: sessions, engaged sessions, key events and revenue by landing page and content group, filtered to Organic Search.
Keep what the connector can’t supply in a small Google Sheet you update monthly: indexed counts, AI feature impressions and content costs. The connector only carries Performance data (web, image, video and news, plus Discover and Google News on the URL table), not the generative AI or Page indexing reports.
Step 2: Add four calculated fields
Add these in the data source. Replace the example brand terms and use the exact field names your data source shows.
Brand group (Site Impression source):
CASE
  WHEN Query IS NULL THEN "Anonymized"
  WHEN REGEXP_CONTAINS(LOWER(Query), "acme|acmee|acme app") THEN "Branded"
  ELSE "Non-branded"
END
Google’s connector documentation says Data Studio may group hidden queries into one row with a blank query; IS NULL matches empty or null values, so the first line keeps that row out of non-branded. A regex won’t match Search Console’s AI-assisted brand filter exactly, so keep one definition and say which one you use.
Cluster (URL Impression source):
REGEXP_EXTRACT(Landing Page, "^https?://[^/]+/([^/]+)/")
This returns the first folder of each URL, such as blog or glossary; it’s the pattern Google uses in its REGEXP_EXTRACT example. If your URLs have no folders, use GA4 content groups or a CASE statement on slug keywords.
CTR, recalculated:
SUM(Clicks) / SUM(Impressions)
Set the type to percent. Recalculating from sums keeps CTR correct at any level of grouping.
Join key for blending Search Console with GA4:
REGEXP_REPLACE(Landing Page, "^https?://[^/]+", "")
Search Console reports full URLs, while GA4’s Landing page is a path. Strip the protocol and host, then blend on this field. Expect a few mismatches from trailing slashes and query strings.
Step 3: Lay out four pages
- Page 1, Overview: nine scorecards compared with the previous period, with a date control set to the last 28 days. Indexed rate, AI feature impressions and ROI come from the sheet.
- Page 2, Search visibility: clicks and impressions over time split by brand group, a cluster table with impressions, clicks, CTR and average position, and AI feature impressions by page from the sheet.
- Page 3, Engagement and conversions: a GA4 landing page table with sessions, engagement rate, key events and session key event rate, key events by content group, and revenue or pipeline.
- Page 4, Refresh queue: a URL Impression table by landing page with a comparison date range, sorted by change in clicks. Apply KPI 9’s minimum-click rule when you review it.
For a ready-made start, the connector documentation points to the Search Console category in the Data Studio template gallery.
If you publish with Skribra, the company behind this blog, its Search Console insights show clicks, impressions, CTR, average position and indexing status per article, with up to 16 months of history. The $75/month Pro plan runs all five maintenance agents, including Hook, which rewrites titles and meta descriptions where CTR is below what the position should earn, and Scout, which refreshes pages at positions 5–15 or losing clicks against their 28-day baseline. Engagement, key events and ROI still come from GA4.
How to read SEO KPIs together
Single KPIs mislead; pairs explain. When two numbers move in opposite directions, start here.
| Pattern | Likely causes | Check next |
|---|---|---|
| Non-branded impressions up, clicks flat or down | More AI answers or rich results on your queries, or weaker snippets | AI feature impressions (3), CTR gap (5) |
| AI feature impressions up, clicks down | Searchers get the answer on Google | Engagement and key event rate of the clicks you still get (6, 7) |
| Clicks steady, engagement rate down | Intent drift, or a page change such as a new layout, slow load or pop-up | Landing page report, recent site releases |
| Traffic up, key event rate flat | Informational traffic, a missing or irrelevant CTA, or key events not marked | Key event setup, CTA placement (7) |
| Indexed rate down | Duplicates, noindex tags, crawl or quality issues | Page indexing report reasons (1) |
| Branded clicks up, non-branded flat | Growth comes from brand awareness, not content | Non-branded impressions by cluster (2) |
Expect some of the impressions-up, clicks-down pattern. In Pew Research Center’s analysis of March 2025 browsing data from 900 US adults, users who saw an AI summary clicked a traditional search result on 8% of visits, against 15% when no summary appeared, and clicked a link inside the summary on 1% of visits. Separately, a paper posted to arXiv in August 2026 by Athena Chapekis, a co-author of the Pew analysis, and three colleagues found that the association between AI Overviews and fewer clicks held after controlling for individual panelists and query attributes.
Why your blog traffic isn’t converting
When organic traffic grows and leads don’t, check these four causes, cheapest to test first:
- Tracking. The form or sign-up isn’t marked as a key event, fires on an untagged thank-you page, or happens on another domain (a checkout, a scheduler) that GA4 doesn’t connect to the session. Submit the form yourself and confirm the event appears in GA4’s Realtime report.
- Intent. The page ranks for “what is” and “how to” queries where readers aren’t ready to buy. That’s normal: judge those pages on engagement and give them a next step that fits the question, like a template, checklist or related comparison.
- No next step. The page has no call to action, or a generic one unrelated to the topic.
- Wrong audience. The clicks come from queries, countries or devices you can’t serve. Check the page’s queries and country split in Search Console.
How to measure SEO content ROI
Content ROI = (value attributed to content − cost of the content) ÷ cost of the content.
Cost is everything it took to produce and maintain the pages in the period: writer and editor time, freelance fees, design, a pro-rated share of tools, and refresh work.
Value depends on your business model. Pick one method and keep it:
- Ecommerce: GA4 purchase revenue from Organic Search sessions that landed on content pages.
- Lead generation: organic key events × value per lead, where value per lead = lead-to-customer rate × average first-year customer value, both from your CRM.
- SaaS sign-ups: organic trials × trial-to-paid rate × average revenue per account.
Attribution: Session default channel group credits the channel of the session where the key event happened; First user default channel group credits the channel that first brought the user. With sales cycles longer than one visit, report both, because content often starts journeys that finish through direct or branded search.
Timing: Google’s SEO Starter Guide says some changes take effect in a few hours and others take several months, and suggests waiting a few weeks before judging a change. Measure ROI by publish cohort, such as one quarter’s posts, over 6 to 12 months.
A worked example with illustrative numbers (not real data):
| Input | Value |
|---|---|
| Articles published in Q1 | 20 |
| Cost: writing, editing, tools, refreshes | $6,000 |
| Organic demo requests from those pages over 6 months | 40 |
| Lead-to-customer rate | 10% |
| Average first-year customer value | $2,000 |
| Attributed value | 40 × 10% × $2,000 = $8,000 |
| ROI | ($8,000 − $6,000) ÷ $6,000 = 33% |
If your value per lead is an estimate, say so and show the break-even point too. In this illustrative example, the cohort pays for itself at 30 demo requests, at the same close rate and customer value.
Reporting cadence: weekly checks, monthly decisions
- Weekly (15 minutes): look for breakage, not trends: a drop in indexed rate, a one-day cliff in impressions, a key event count at zero (usually a broken tag), or AI feature impressions that vanish.
- Monthly: review all nine KPIs by cluster, update the sheet, pick the refresh queue and decide what to keep, fix or stop.
- Quarterly: calculate content ROI by publish cohort, and confirm the BigQuery export is running or pull the last quarter from the API.
Keep the executive view stable, the same nine numbers in the same order, and annotate it with site releases, migrations and confirmed Google updates.
Where to start if you track nothing today
Start with four KPIs this week: indexed rate, non-branded clicks, CTR against your baseline and organic key event rate. They need only Search Console and GA4 and show whether pages can rank, earn the click and make the click count. Add the other KPIs next month, and content ROI once you have a quarter of cost data.
Then use the chain to decide, cluster by cluster:
- Keep publishing where pages get indexed, non-branded clicks grow and key events follow.
- Fix before adding where impressions grow but CTR, engagement or key events lag behind.
- Stop and clean up where the indexed rate falls. More pages won’t help until Google indexes the ones you already have.
Frequently Asked Questions
- What are the most important SEO KPIs?
- For most content programs: non-branded organic clicks, organic key event rate and indexed rate. Clicks show reach, key events show business value, and indexed rate shows whether your pages can compete at all.
- What should an SEO dashboard include?
- Non-branded clicks and impressions over time and CTR by page or cluster from Search Console, organic engagement rate and key events by landing page from GA4, and a refresh queue of pages losing clicks. Data Studio, formerly Looker Studio, connects to both for free.
- How do you calculate SEO ROI?
- Subtract the cost of your content from the value attributed to it, then divide by the cost. Value is organic revenue from GA4, or organic key events times a value per lead from your CRM. Measure it per publish cohort over 6 to 12 months, because search results take time to build.
- Why is my blog traffic not converting?
- Check tracking first: make sure the form or sign-up is marked as a key event in GA4 and fires on every path. Then check intent, since informational posts attract readers who aren't ready to buy. A missing or irrelevant call to action, or traffic you can't serve, are the other common causes.
- How do I track AI Overviews in Search Console?
- Use the generative AI performance report, available to all sites since August 31, 2026. It shows impressions in AI Overviews and AI Mode by page, country, date and device, but no clicks and no queries. Clicks on links in AI Overviews are counted in the regular Performance report.
Turn your SEO KPIs into next actions
Skribra connects to Google Search Console and shows clicks, impressions, CTR, average position and indexing status for every article it publishes. Its maintenance agents use that data to refresh pages that are slipping and to rewrite titles that don’t earn the click.
Plans start at $19/month for 5 articles, the $75/month Pro plan runs all five maintenance agents on every article, and every plan comes with a 3-day free trial.
Written by
Skribra
This article was crafted with AI-powered content generation. Skribra creates SEO-optimized articles that rank.
Share: