August 22, 2026
·
Updated October 28, 2026
·
16 min read
SERP Metrics: 9 to Track in 2026 and How to Measure Them
A practical guide to nine SERP metrics: what each one measures, how to calculate it from Google Search Console and rank-tracking data, and which decisions it should inform, plus a weekly scorecard template.

SERP metrics measure how your site shows up on Google's results page, not just where it ranks. The nine worth tracking in 2026 are organic impression share, rank distribution, share of voice, SERP feature ownership, AI Overview citations, pixel position, CTR by position and layout, ranking volatility, and the branded vs non-branded split.
Average position alone doesn't tell you much anymore. A results page can show an AI Overview, ads, a People Also Ask box and a video carousel before the first blue link, so "position 3" can mean very different things on two different queries. Below, each metric gets a plain definition, a formula, where to get the data, and the decision it should drive. At the end there's a weekly scorecard you can copy.
What are SERP metrics?
SERP metrics describe your presence on the search engine results page: how often you appear, where, in what format, next to which features, and how often that turns into a click. A rank tracker tells you that you’re in position 4. SERP metrics tell you whether position 4 sits under an AI Overview and a shopping grid, whether a competitor owns the featured snippet above you, and whether you’re getting the clicks that position should earn.
Your own clicks, impressions and positions come from Google Search Console, which is the only first-party source. What the page looked like, and how competitors did on it, needs a rank tracker, a SERP API or a manual check. Most of the nine metrics combine the two.
| # | Metric | Question it answers | Main data source |
|---|---|---|---|
| 1 | Organic impression share | How much of the available demand sees you at all? | Search Console + keyword volumes |
| 2 | Rank distribution | Where do your keywords actually sit? | Search Console export or rank tracker |
| 3 | Share of voice | How much of the click opportunity do you win vs competitors? | Rank tracker |
| 4 | SERP feature ownership | Do you hold the snippet, PAA or video slots? | Rank tracker with feature tracking |
| 5 | AI Overview presence and citations | Does an AI answer appear, and does it cite you? | Rank tracker or SERP API + Search Console’s generative AI report |
| 6 | Pixel position | How far down the screen is your result? | Rank tracker with pixel tracking |
| 7 | CTR by position and layout | Are you getting the clicks your position should earn? | Search Console |
| 8 | Ranking volatility | Is a move caused by you or by Google? | Your rank history + public volatility trackers |
| 9 | Branded vs non-branded split | Is growth coming from new searchers or people who already know you? | Search Console branded queries filter |
Looking for SERPmetrics, the rank-tracking API?
“SERPmetrics” is also the name of a rank-tracking company, so some people searching this term want the product, not the metrics. An archived copy of serpmetrics.com from January 2025 describes it as a high-volume SERP data API, established in 2009, with processed JSON and raw HTML results, geo-targeted and multi-device crawls, and free “Flux” charts built from more than 100,000 queries a day to flag Google algorithm changes. As of October 2026, serpmetrics.com no longer shows the product and redirects to a domain-sale page, and there’s no public sign of where the service runs now, so it isn’t reviewed here. If you need the same kind of data today, the tool table further down lists the types of tools that cover each metric.
Visibility metrics: do you show up?
These three measure your footprint across a keyword set before any question of clicks. Track them per topic cluster, not across the whole site, or one strong cluster will hide a weak one.
1. Organic impression share
Organic impression share is the portion of searches for a keyword set where your site appeared at all. Unlike the Google Ads metric of the same name, the organic version has to be estimated.
- Formula: impressions for the cluster in Search Console ÷ estimated searches for the same queries over the same period. For example, if a cluster’s queries add up to about 10,000 searches a month and Search Console shows 6,200 impressions over 30 days, your impression share is roughly 62%.
- Where to get it: impressions from the Search Console Performance report (filter by query or page), and search volumes from your keyword tool.
- Decision it drives: low share on a high-intent cluster means a coverage gap, so you need a new page or a better-targeted one. High share with few clicks sends you to metric 7.
- Watch out: keyword volumes are rounded, seasonal estimates, so treat the percentage as a trend line, not an exact figure. Keep the same volume source every month.
2. Rank distribution
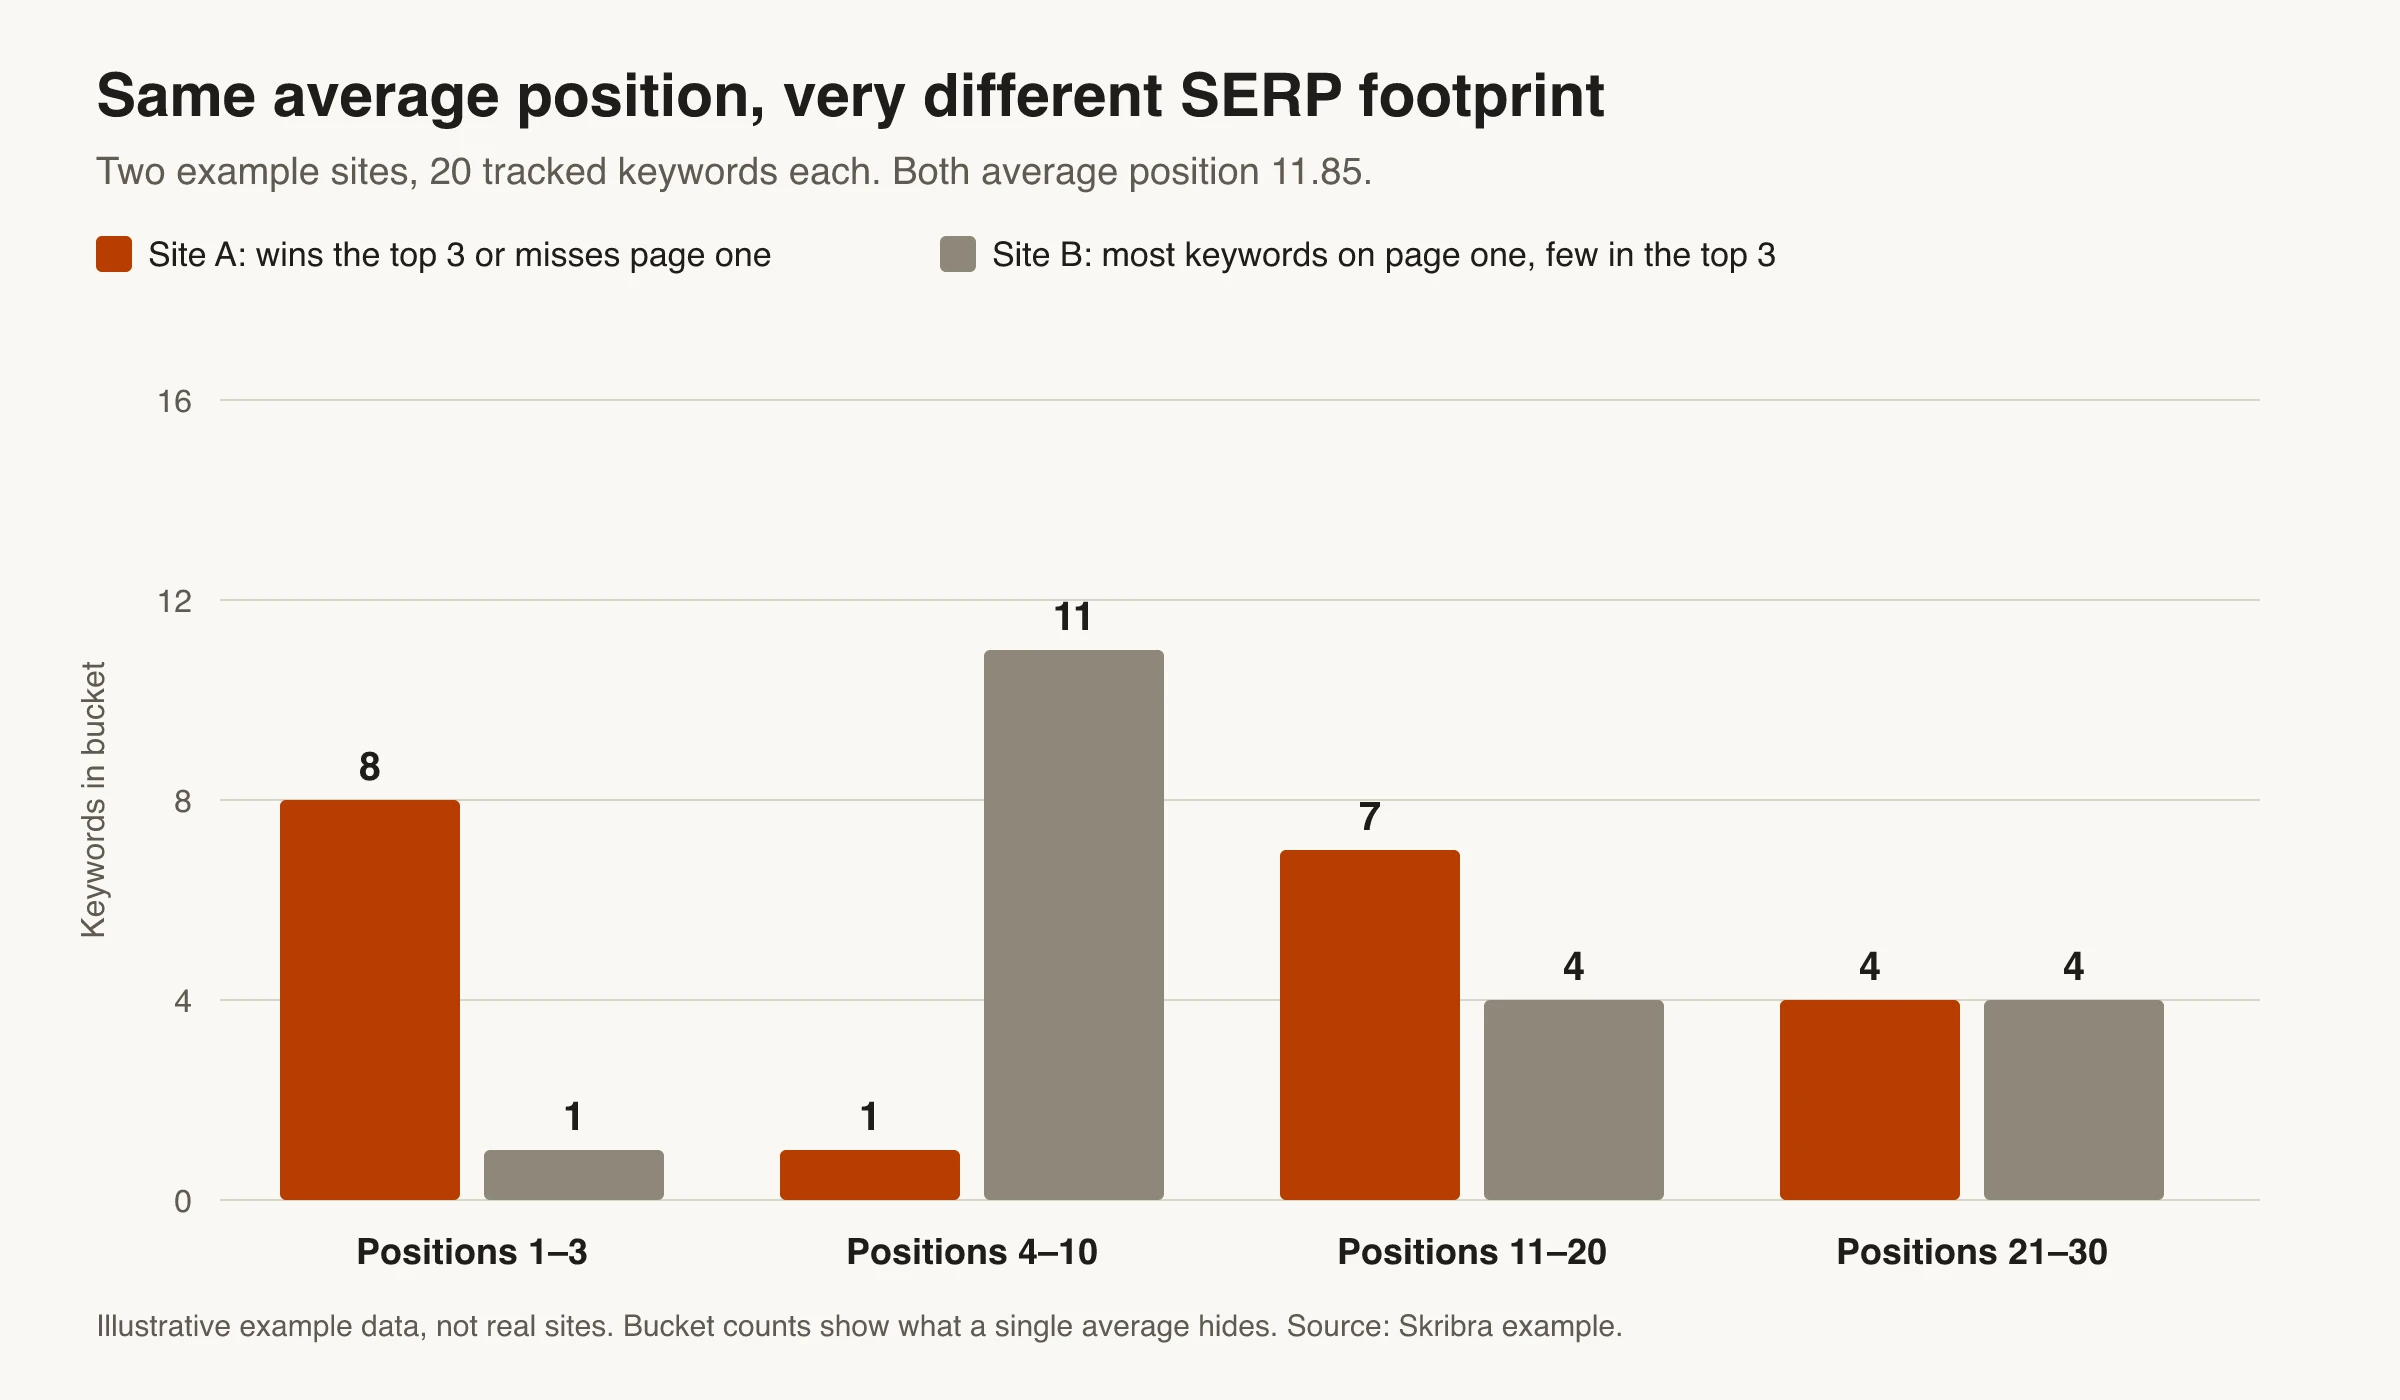
Rank distribution counts how many of your keywords sit in each position bucket, usually 1–3, 4–10, 11–20 and 21+. It exists because average position hides the shape of your rankings. In Search Console, average position is the topmost position your site held for each query, averaged across queries, and a position is only recorded when your link gets an impression (Google’s explanation of Performance report metrics).
- Formula: keywords in a bucket ÷ total tracked keywords, recorded weekly.
- Where to get it: export the Queries table from Search Console and bucket the average position column, or use the distribution view most rank trackers include. The export leaves out anonymized queries and stops at 1,000 rows, so read up on anonymized queries and the 1,000-row limit before you trust the counts.
- Decision it drives: keywords moving from 11–20 into 4–10 are your best near-term wins. Refresh those pages and point internal links at them. Keywords slipping out of 1–3 need attention first, because the top positions carry most of the clicks.
- Watch out: a per-query position in Search Console is itself an average across days, devices and locations. Split by device before you bucket.
3. Share of voice
Share of voice estimates how much of the available click opportunity in a keyword set you win, compared with a defined group of competitors. It weights every ranking by search volume and by how many clicks that position typically gets, so a #1 on a big keyword counts for far more than a #1 on a tiny one.
- Formula: for each site, sum (search volume × expected CTR at its position) across the keyword set. Your share of voice is your total ÷ the total for all sites in the competitor set.
- Where to get it: rank trackers calculate it for you once you add competitors. Expected CTR comes from a CTR curve, either a public one such as Advanced Web Ranking’s monthly organic CTR study, which now includes AI Overview data, or one built from your own Search Console data.
- Decision it drives: which competitor is gaining in which cluster, and whether your gains come from new keywords or better positions on old ones.
- Watch out: every tool uses its own CTR curve and keyword sample, so share of voice from two tools isn’t comparable. Pick one tool and stick with it. The denominator is only the competitors you chose.
SERP layout metrics: can searchers see you?
A ranking only matters if people see it. These three metrics track what sits around and above your result.
4. SERP feature ownership
Feature ownership tracks which SERP features appear for each query, such as a featured snippet, People Also Ask, video, images, a local pack, shopping results or top stories, and whether your site holds any of them.
- Formula: feature presence rate = queries showing a given feature ÷ tracked queries. Feature ownership rate = queries where you hold at least one feature ÷ queries where any winnable feature appears.
- Where to get it: a rank tracker with SERP feature tracking. Search Console’s Search appearance tab shows some rich result types for your own pages, but not the features you don’t hold, or who holds them. To find out which competitors hold them, start with competitor keyword research.
- Decision it drives: separate winnable features (snippets and PAA for informational queries, video if you publish video) from unwinnable ones (shopping or a local pack if you don’t sell or serve locally). Put effort only into the first group. We cover that split in more depth in on-page SEO vs SERP features.
- Watch out: snippets come and go, so count ownership over several weeks.
5. AI Overview presence and citations
This is two numbers: how often an AI Overview appears for your tracked queries, and how often it links to your page when it does.
It matters because AI answers change click behavior. In a Pew Research Center analysis of 900 US adults’ browsing in March 2025, users who saw an AI summary clicked a traditional search result in 8% of visits, against 15% when no summary appeared. They clicked a link inside the summary in just 1% of visits.
- Formula: AI Overview presence rate = tracked queries showing an AI Overview ÷ tracked queries. Citation rate = queries where the AI Overview links to your site ÷ queries showing one.
- Where to get it: rank trackers and SERP APIs that capture AI Overviews, plus manual spot checks on your most important queries. Search Console now has a Generative AI performance report, launched in June 2026 and available to all sites since August 31, 2026. It shows how often links to your pages appeared in AI Overviews and AI Mode, by page, country, device and date. It counts impressions only, combines the two features and has no query breakdown, so it can’t give you a per-query citation rate. The same impressions also sit in the main Performance report under the Web search type (AI features and your website), and Google’s help page on metrics says an AI Overview occupies a single position, shared by every link inside it.
- Decision it drives: if an AI Overview appears and doesn’t cite you, make the page easier to cite: a direct answer near the top, clear headings that match the question, and specifics the overview can’t summarize away. If you’re cited and CTR still falls, judge the page by conversions, not clicks alone.
- Watch out: AI Overviews don’t appear consistently for the same query. Check several times across days and devices before drawing conclusions.
6. Pixel position
Pixel position measures how far down the page your listing starts, in pixels, rather than its numbered rank. Advanced Web Ranking defines it as “the distance, in pixels, from the top of the search results page to your listing” (AWR on pixel position). The related above-the-fold rate tells you whether searchers can see your result without scrolling.
- Formula: pixel position per keyword and device. Above-the-fold rate = tracked keywords whose result starts above the fold ÷ tracked keywords.
- Where to get it: rank trackers that offer pixel tracking. There’s no fixed fold, so tools estimate one. AWR, for example, uses standard screen sizes of 1920×1080 for desktop and 360×800 for mobile.
- Decision it drives: if CTR falls while your rank holds, check whether your pixel position dropped because a new feature appeared above you. If it did, the fix is a feature you can win or a different target query, not a new title.
- Watch out: desktop and mobile pixel positions differ a lot, so track them separately.
Click and stability metrics: does visibility turn into traffic?
The last three connect what you see on the SERP to the clicks in your reports, and help you tell real changes from noise.
7. CTR by position and layout
Click-through rate is clicks ÷ impressions. On its own it’s hard to read, because CTR depends heavily on position and on what else is on the page. The useful number is the gap between the CTR you get and the CTR you’d expect for that position, on that device, on that kind of layout.
- Formula: CTR gap = actual CTR − expected CTR, where expected CTR is the median CTR of your own non-branded queries at the same position band and device. Use only rows with enough impressions to be stable. A minimum of 100 impressions per query is a reasonable starting point.
- Where to get it: Search Console for clicks and impressions (here’s how Search Console counts impressions and position). Tag each query’s layout (AI Overview, shopping, local pack, video-heavy, plain) from your rank tracker or a manual check.
- Decision it drives: a negative gap on a plain layout usually means the snippet is the problem: rewrite the title and meta description, and check how it renders with a SERP preview tool. A negative gap on a crowded layout is a layout problem, so target the feature or a different query. Our list of search results page errors that hurt CTR covers the snippet-level fixes.
- Watch out: branded queries have much higher CTR and will flatter your averages. Calculate the gap on non-branded queries (metric 9).
To segment CTR in Search Console:
- In Performance → Search results, filter to the page or folder you’re investigating.
- Apply the Non-branded filter, or exclude brand terms with a query filter.
- Add a Device filter and review mobile and desktop separately.
- Build intent clusters with a regex query filter, for example
^(how|what|why)for informational queries andbest|vs|alternative|review|pricingfor commercial ones. - Export each cluster and filter to average positions between 4 and 15, sorted by impressions. That’s your short list for snippet or layout fixes.
8. Ranking volatility
Volatility measures how much your positions move, separated from how much the whole SERP is moving. Without it, you’ll react to Google’s changes as if they were yours.
- Formula: for each keyword, the average absolute day-to-day position change over 7 or 28 days. Your site’s volatility is the average across tracked keywords, compared against an industry index for the same period.
- Where to get it: your rank tracker’s history, plus public trackers such as Semrush Sensor and MozCast. Check the Google Search Status Dashboard for confirmed ranking updates and their rollout dates.
- Decision it drives: if only your site moved, look at your own changes first: deployments, template edits, removed content, internal link changes. If the whole market moved during a confirmed update, annotate it and wait for the rollout to finish before rewriting anything.
- Watch out: without a dated change log of releases, content updates and tracking changes, you can’t tell the two causes apart.
9. Branded vs non-branded split
Branded queries come from people who already know you. Non-branded queries show whether SEO is reaching new people. Mixing them hides both.
Google added a branded queries filter to the Search Console Performance report in November 2025, and on March 11, 2026 it became available to all eligible sites (Google’s announcement). It uses an AI-assisted system rather than a keyword list, so it also catches misspellings and queries for products unique to your site. It works across web, image, video and news search, but only for top-level properties with enough query volume, and Google notes some queries may be misclassified. If you don’t see it, a regex query filter with your brand name and common typos is the fallback.
- Formula: non-branded click share = non-branded clicks ÷ total clicks. Track non-branded impressions, clicks, CTR and position as their own series.
- Where to get it: the branded and non-branded filter in the Performance report, or the clicks breakdown card Google added to the Insights report.
- Decision it drives: judge content and SEO work on non-branded growth. Branded growth reflects brand demand, which PR, product and paid campaigns also drive.
Which tools measure each SERP metric?
No single tool covers all nine. Search Console is free and covers your own site’s clicks, impressions and positions, but it can’t show the page layout or your competitors. Rank trackers fill in features, competitors, pixel position and AI Overview tracking for the keywords you choose. SERP APIs return raw results data if you’d rather build your own reports.
| Metric | Google Search Console | Rank tracker | SERP API | Manual check |
|---|---|---|---|---|
| 1. Organic impression share | Impressions (needs volumes from a keyword tool) | Some estimate it | No | No |
| 2. Rank distribution | Yes, via export | Yes | Yes, if you build it | No |
| 3. Share of voice | No | Yes | Yes, if you build it | No |
| 4. SERP feature ownership | Partly (your rich results only) | Yes | Yes | Yes, small samples |
| 5. AI Overview presence and citations | Partly (AI feature impressions by page, no queries) | Some trackers | Some APIs | Yes, small samples |
| 6. Pixel position | No | Some trackers | Some APIs | Roughly |
| 7. CTR by position and layout | Yes (CTR); layout needs another source | Layout tags | Layout tags | Layout tags |
| 8. Ranking volatility | Daily position data | Yes | Yes, if you build it | No |
| 9. Branded vs non-branded split | Yes, branded queries filter | Partly, by keyword tags | No | No |
If you mainly want per-article numbers, Skribra’s Search Console insights shows clicks, impressions, CTR and average position for each article it publishes, with up to 16 months of history. Skribra is our product. Its Hook agent uses that data to find pages with plenty of impressions and a CTR below what their position should earn, then rewrites only the title and meta description. It works from your own Search Console data, so you’d still need a rank tracker for competitor, SERP feature and pixel data.
Deciding between automated tracking and manual checks? Our comparison of rank tracking tools vs manual checks for reporting goes through accuracy, cost and coverage.
How to build a weekly SERP scorecard
A scorecard keeps the nine metrics from becoming nine dashboards. One row per keyword cluster, one column per metric, one action per row.
- Define the keyword set. Start with 50 to 200 queries you want to win, grouped by intent and topic. Group by the intent behind each query, not by shared words.
- Pick one primary metric per cluster. Use share of voice for competitive commercial clusters, CTR gap for clusters already on page one, and impression share for clusters you’re still building.
- Pull the data on the same day each week, with the same date range and separate device splits.
- Annotate releases, content updates and confirmed Google updates.
- Set triggers that force a decision, such as a cluster losing top-3 keywords two weeks in a row or a CTR gap below your own median. Tune the thresholds to your data.
Here’s the template with example values (not real data) so you can see how it reads:
| Cluster | Impression share | Top 3 / 4–10 / 11–20 | Features owned | AI Overview cited | CTR gap | Volatility vs index | Non-branded clicks (wk/wk) | Action |
|---|---|---|---|---|---|---|---|---|
| Example: “how to” guides | 58% | 6 / 14 / 9 | 3 of 11 snippets | 2 of 9 | −1.2 pts | Normal | +4% | Refresh 4–10 pages, add direct answers |
| Example: tool comparisons | 31% | 1 / 5 / 12 | 0 of 4 | 0 of 2 | −3.5 pts | High | −11% | Hold edits until the update finishes, then rewrite snippets |
| Example: glossary terms | 72% | 9 / 6 / 3 | 5 of 8 PAA | 4 of 10 | +0.4 pts | Normal | +2% | Defend top 3, link to commercial pages |
Each week, read across the row and pick the single change most likely to move that cluster. If a column never changes a decision, drop it. For the business side, pair this with the SEO content marketing metrics that connect search to signups and revenue.
Common SERP measurement mistakes
- Averaging positions across unrelated queries. A site-wide average position mixes your best and worst clusters into one meaningless number. Use rank distribution per cluster.
- Mixing branded and non-branded data. Brand queries inflate CTR and hide non-branded losses.
- Trusting one screenshot. Results vary by location, device and time, and AI Overviews appear inconsistently. Sample more than once.
- Rewriting during an update. Wait until a confirmed update finishes rolling out before you change pages that moved.
Our SEO guide covers the fundamentals behind these metrics if you’re setting up measurement from scratch.
Where to Start if You Track Nothing Today
You don’t need all nine on day one. Start with the three that Search Console gives you for free: rank distribution, CTR gap and the non-branded split. Together they show where your keywords sit, whether they earn the clicks they should, and whether growth is reaching new people.
Add a rank tracker when you need to see competitors, SERP features, AI Overview citations or pixel position. Then fold everything into the weekly scorecard, and judge each metric by one test: did it change what you did this week?
Frequently Asked Questions
- What are SERP metrics?
- SERP metrics measure how your site appears on search engine results pages: how often you show up, where, next to which features, and how often that turns into a click. They go beyond a single rank number to include things like rank distribution, SERP feature ownership, AI Overview citations, CTR by position and share of voice.
- What is the most important SERP metric?
- For most sites it's CTR compared with what your position should earn, measured on non-branded queries. It connects visibility to traffic and shows whether the problem is your snippet or the layout around it. For competitive markets, share of voice matters just as much.
- How do you measure SERP visibility?
- Start with impressions and rank distribution from Google Search Console for a defined keyword set. For a competitive view, use a rank tracker's share of voice, which weights each ranking by search volume and expected CTR. Track it per topic cluster and keep the same tool and keyword set over time.
- Can Google Search Console track AI Overviews?
- Partly. Since mid-2026, Search Console has a Generative AI performance report that shows how often your pages appeared in AI Overviews and AI Mode, by page, country and device. It counts impressions only and has no query breakdown, so to see which queries show an AI Overview and whether it cites you, use a rank tracker or SERP API that captures them, plus manual spot checks.
- Is SERPmetrics still available?
- SERPmetrics was a rank-tracking and SERP data API founded in 2009, known for its free Flux volatility charts. As of October 2026, serpmetrics.com redirects to a domain-sale page, and there's no public sign that the service still runs. Check with the company directly before relying on it.
- How often should you check SERP metrics?
- Weekly is enough for most sites. Pull the data on the same day each week with the same date range, and review trends monthly. Daily checks mostly show noise, except during a confirmed Google update when you want to watch volatility.
See How Every Article Performs in Search
Skribra connects to Google Search Console and shows clicks, impressions, CTR and average position for every article it publishes, with up to 16 months of history. Its agents then act on that data, rewriting titles and meta descriptions on pages with high impressions and low CTR, and refreshing pages that sit in striking distance.
Plans start at $19/month, and every plan comes with a 3-day free trial.
Written by
Skribra
This article was crafted with AI-powered content generation. Skribra creates SEO-optimized articles that rank.
Share: