June 21, 2026
·
Updated October 28, 2026
·
14 min read
Google Search Console Guide: Every Report Explained
Google Search Console is Google's free reporting tool for site owners. It shows which searches surface your pages, how often people click, which URLs Google has indexed and what's holding the rest back. This guide covers every major report as of October 2026, including the new generative AI report for AI Overviews and AI Mode, with the data limits Google documents and the action each report should lead to.

Most confusion in Search Console comes from treating it as one database. It isn't. The Performance report is built from logged search results and usually runs two to three days behind. The Page indexing report reflects Google's index. URL Inspection shows one page as of its last crawl, unless you run a live test. Crawl stats counts the requests Googlebot actually made. When two reports disagree, they're usually describing different stages, not contradicting each other.
If you haven't added and verified your site yet, start with the Search Console setup guide: property type, verification and user access. Everything below assumes a verified property.
How Search Console data is produced
Every number in Search Console comes from one of a few stages. Google discovers a URL through links, sitemaps or redirects, crawls it, decides whether to index it and under which canonical URL, serves it in results, and then logs and aggregates what searchers saw and clicked. Each report sits on top of a different stage, which is why they update on different schedules and can briefly disagree. For how crawling and rendering work under the hood, see what technical SEO is and how it works.
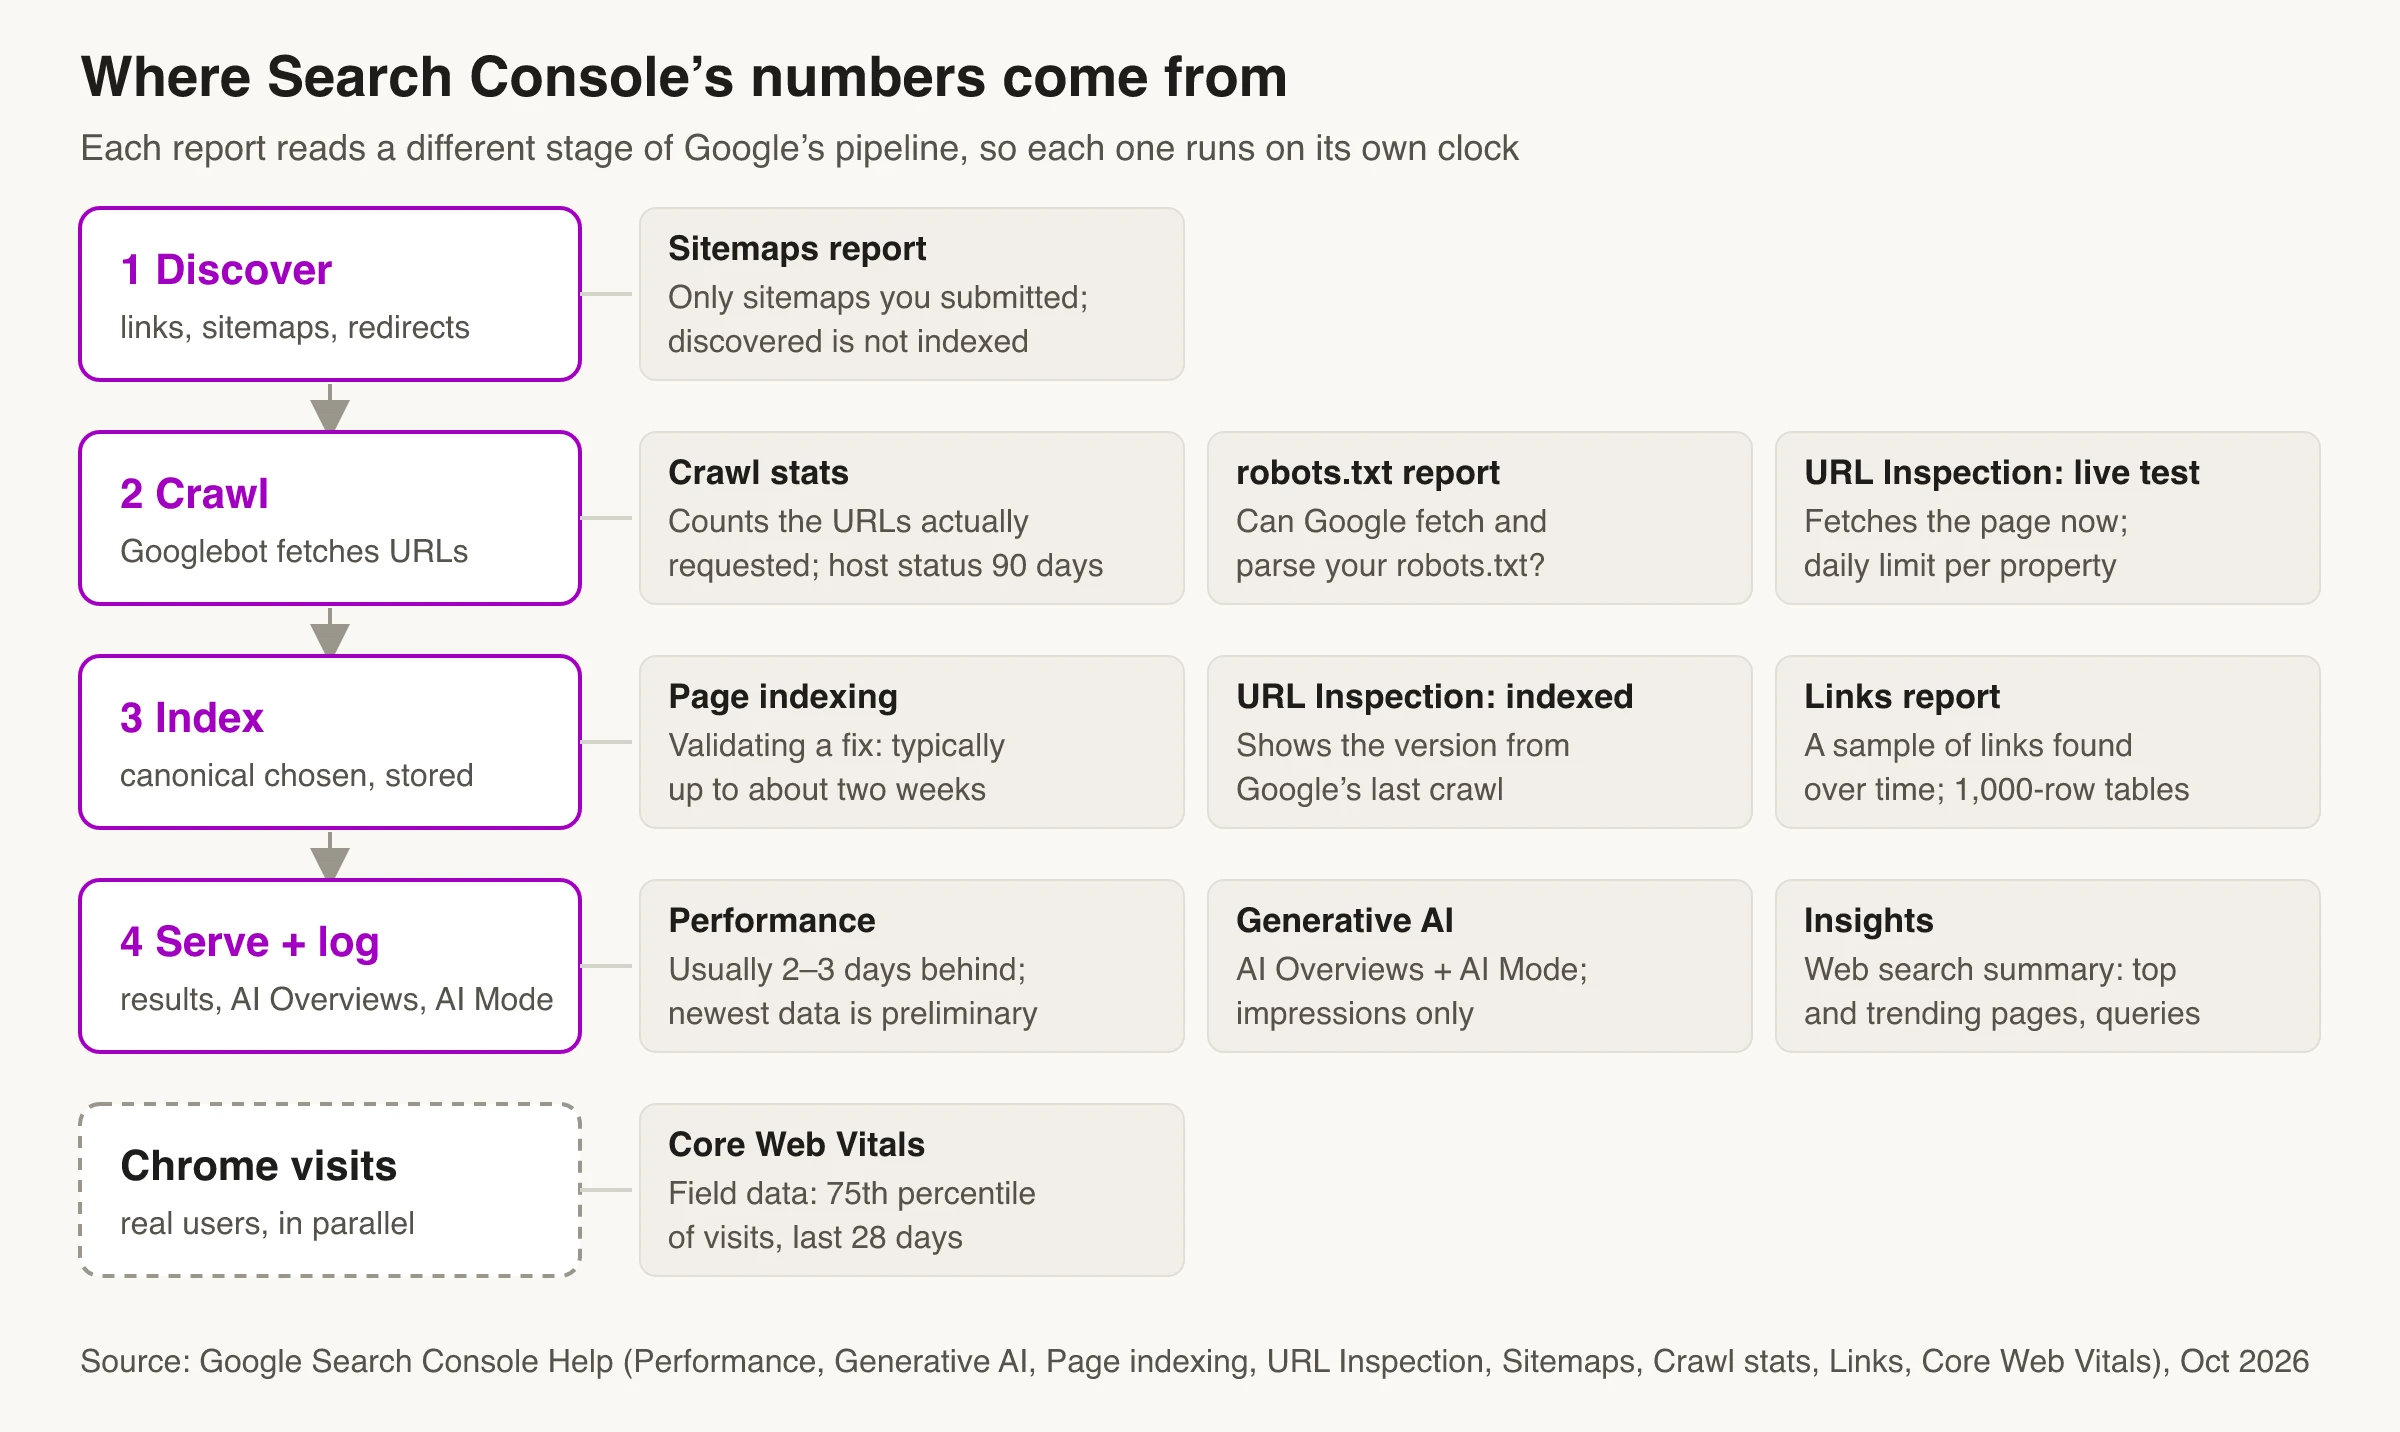
Pick the report by the question you’re asking:
| Question | Report to open | What it can’t tell you |
|---|---|---|
| Is Google sending traffic, and for which queries? | Performance | The last few hours with certainty (newest data is preliminary) |
| Do my pages appear in AI Overviews or AI Mode? | Generative AI performance | Clicks, queries or position (impressions only) |
| What changed this week, at a glance? | Insights | Anything you need to filter or segment |
| Are my important pages indexed? | Page indexing | Why one specific URL behaves the way it does |
| What does Google know about this one URL? | URL Inspection | Whether the page will rank |
| Did Google read my sitemap? | Sitemaps | Whether the listed URLs were indexed |
| Are real visitors getting a fast page? | Core Web Vitals | Results of a single lab test |
| Who links to me? | Links | A complete list of links |
| Is Googlebot struggling with my server? | Crawl stats | Anything for a subfolder property |
Google’s own Search Console Training episode below walks through how this data is collected and processed. It was recorded in 2020, so it predates the generative AI and multimodal reports, but the pipeline it describes still applies.
Performance report: clicks, impressions, CTR and position
The Performance report for Search results is what most people mean by Search Console. By default it shows the last three months of clicks and impressions from Google Search. You can switch on CTR and average position, group the table by query, page, country, device, search appearance or date, and filter by search type: Web (text-based or multimodal), Image, Video or News. Discover and Google News get separate Performance reports once a site has enough traffic there. Google’s Performance report documentation lists every option.
What each metric actually counts
- Impressions: a link to your site appeared on the current page of results, whether or not the searcher scrolled to it. Inside carousels and expandable widgets, the item usually has to be scrolled into view or expanded first.
- Clicks: a click that took the searcher to your site. Clicking a link inside an AI Overview or AI Mode response counts.
- CTR: clicks divided by impressions.
- Average position: the topmost position your site held in each result set, averaged across impressions. An AI Overview occupies a single position, and every link in it gets that position.
Two details explain most numbers that look wrong. First, the chart is always aggregated by property, while the table switches to per-page counting when you group by page or search appearance. If three of your pages appear for one search, the property view records one impression at position 1. The page view records an impression for each URL, at positions 1, 2 and 3. Clicks work the same way: one searcher clicking two of your URLs counts as one click for the property and two clicks by page. Second, data is credited to the canonical URL Google selected, so clicks on a duplicate URL show up under the canonical page. Google’s page on how impressions, clicks and position are counted has the details for each result type.
Data limits Google documents
- Delay: collected data is usually available in two to three days. The newest data can be preliminary and is drawn as a dotted line. The 24-hour view shows hourly data in your local time zone; every other view uses Pacific Time.
- History: 16 months. Choose “Last 16 months” in the date filter for year-over-year comparisons. To keep data longer, pull it through the Search Analytics API or the bulk data export to BigQuery.
- Anonymized queries: queries that aren’t issued by more than a few dozen users over a two-to-three-month period are left out of the query table. They still count in the chart totals unless you add a query filter, which is why “containing” plus “not containing” rarely adds up to the total.
- Row limits: tables show at most 1,000 rows, and the interface exports 1,000 rows. The API returns up to 50,000 rows per day per site per search type. The BigQuery bulk export includes all performance data except anonymized queries. Google explains both limits in its deep dive on performance data filtering.
If a chart looks empty or a query you expected is missing, these seven Search Console mistakes cover the usual causes, from the wrong property to filters left on.
Filters and features worth knowing in 2026
- Regex filters on queries and pages use RE2 syntax with partial matching, and they aren’t case-sensitive by default. Use them to bundle query variants, such as
(pricing|price|cost). - Branded vs non-branded queries: a built-in filter that separates searches containing your brand name, domain or brand-specific products. Its data history starts in March 2025. It isn’t available for subfolder properties such as example.com/blog/ or for sites with few impressions, and Google notes some queries get misclassified.
- Weekly and monthly granularity smooths out day-of-week swings, and Google recommends it when comparing date ranges. Only one comparison can be active at a time.
- Web: multimodal is a search type added in September 2026 for searches made with images: Google Lens, Circle to Search, image uploads and Chrome’s image search. The Queries tab isn’t available for it, because those searches have no text query.
- Annotations: right-click the chart to mark a release, migration or fix. A property holds up to 200 notes of up to 120 characters, they’re deleted after 500 days, and they don’t show in comparison mode or the 24-hour view.
Why the numbers won’t match GA4
Search Console counts what happened on Google’s results page. Google Analytics counts what happened on your site after the page loaded. Google’s data discrepancies page lists the main reasons they diverge: privacy filtering of rare queries, processing such as removing duplicates, the two-to-three-day lag, Pacific Time day boundaries, and the fact that Analytics only records visitors whose browsers run JavaScript. Visitors who decline analytics cookies or block the tag widen the gap on the Analytics side.
Compare trends over identical date ranges rather than totals. If you want both sources side by side, connect Search Console to GA4 and read Search Console data inside Analytics.
Turning Performance data into action
- Open Pages, sort by impressions and look for pages with plenty of impressions but a low CTR. Google’s own advice is to rewrite the title and description so they match the queries showing the page, or to adjust the content to fit those queries better. If CTR is dropping across many pages at once, here’s how to troubleshoot a falling click-through rate.
- Click a page, then open Queries to see what Google actually shows it for. For a step-by-step walkthrough, see how to check keyword rankings in Search Console. Missing queries you expected point to content gaps. Unrelated spammy queries (Google’s examples are terms like “casino”) can be a sign the site was hacked.
- Compare the last 28 days with the previous period and sort by the Difference column to find the pages and queries that moved most.
- Add an annotation whenever you ship a significant change, so the next shift in traffic has context.
To track these numbers over time, turn Search Console data into SEO KPIs and a simple monthly dashboard.
Generative AI performance report: AI Overviews and AI Mode
Google launched dedicated generative AI performance reports on June 3, 2026, starting with a subset of sites, and had rolled them out to all websites worldwide by August 31, 2026, according to the Search Central launch post. There are two: one for Search, covering AI Overviews and AI Mode, and one for generative AI features in Discover.
As of October 2026, the Search generative AI report shows:
- Impressions only: how many times links to your site appeared in an AI Overview or AI Mode response. There are no clicks, queries, CTR or position; Google says it may add metrics over time.
- Dimensions: pages, countries, devices and dates, with hourly, daily, weekly or monthly granularity.
- Search type: Web text-based or Web multimodal.
- The same underlying data: these impressions are already part of the Web search type in the main Performance report, which is also where clicks from AI features are counted. The new report isolates them.
- Exclusions: Search Labs experiments aren’t included.
If the report doesn’t appear, Google gives two usual reasons: the site hasn’t had enough impressions in AI features, or it has been excluded with the Search generative AI control (Settings > Search generative AI). That control opts a property out of AI Overviews, AI Mode and AI features in Discover, and excluded sites get no traffic or impressions from them.
How AI features show up in the Performance report
Links in AI Overviews and AI Mode follow standard impression rules, and clicking one counts as a click. An AI Overview holds a single position, shared by every link inside it, and a follow-up question in AI Mode counts as a new query. Because these clicks are mixed into Web search, Search Console can’t isolate them today. A workable proxy: take the pages with the most AI-feature impressions and watch their clicks and CTR in the Performance report over the same period.
Turning AI-feature data into action
Use the Pages tab to see which URLs appear most in AI features, and compare them with pages that rank well but never appear there. Google’s guidance on AI features and your website is that no special markup, schema or AI text files are needed to appear in these features; the usual SEO fundamentals apply, with an emphasis on content that isn’t a commodity.
Insights report: the quick weekly view
The Insights report replaced the standalone Search Console Insights beta in 2025 and now sits inside Search Console. It summarizes Web search performance in a few cards: clicks and impressions, your top and trending content, queries leading to your site, top countries, branded vs non-branded traffic, and clicks from other Google sources such as Image, Video, News and Discover.
On sites with enough query data, similar queries are bundled into groups. Each group is named after its best-performing query, and its clicks are the total for every query in the group. “Trending up” and “trending down” compare clicks with the previous period. Use Insights as the starting point for a weekly check, then switch to the Performance report for anything you need to filter. Google is still introducing the report gradually, and an experimental card for social channels such as YouTube, Instagram and TikTok isn’t available to every site.
Page indexing report: what Google has (and hasn’t) indexed
The Page indexing report splits every URL Google knows about into indexed and not indexed, with a reason for each group of non-indexed pages, such as “Crawled - currently not indexed”, “URL marked ‘noindex’” or “Duplicate, Google chose different canonical than user”. Two points from Google’s Page indexing documentation save a lot of worry:
- Not every URL should be indexed. Duplicates, redirects, noindexed pages and intentionally blocked URLs belong in the not-indexed column.
- Small sites may not need the report at all. Google says that with fewer than 500 pages, a
site:search and URL Inspection on your key pages are usually enough.
Filter the report by sitemap (all known pages, all submitted pages or unsubmitted pages only) to check whether the URLs you care about are indexed. Example URL lists are capped at 1,000. For a status-by-status diagnosis and fixes, use the guide to CMS pages that aren’t getting indexed.
How the Validate fix button works
Validation isn’t a re-index button. When you click Validate fix, Search Console checks a few affected pages right away, and if the issue is still there, validation ends. Otherwise it works through the URLs known to have that issue (not the whole site) and fails as soon as it finds one remaining instance. Google says validation typically takes up to about two weeks, sometimes much longer.
You don’t have to validate at all: counts update as Google recrawls, and an issue drops off the table 90 days after its last instance disappears. If you do validate, Google suggests submitting a sitemap of only your most important affected URLs and filtering the report to it first, because a smaller set finishes faster.
URL Inspection: one page, two versions
The URL Inspection tool answers questions about a single URL in your property. It has two modes that are easy to mix up:
- Indexed version (the default): what Google stored at its last crawl, including the crawl date, whether the URL is on Google, the canonical you declared and the canonical Google selected. The Google-selected canonical is only visible here; the live test can’t predict it.
- Live test: fetches the page now and shows a screenshot, the rendered HTML and whether the current version could be indexed. It doesn’t check for duplicates, sitemaps, quality issues, manual actions or removals.
“URL is on Google” means the page is eligible to appear in results, not that it ranks for anything. Inspections and live tests both have per-property daily limits. The Request indexing button lives here too; request indexing vs XML sitemaps covers when each method is worth using and how to confirm it worked.
Sitemaps report
The Sitemaps report lists the sitemaps you’ve submitted through the report or the API, the status of Google’s last read (Success, Couldn’t fetch, or a count of errors) and how many URLs Google parsed from each file. It doesn’t list sitemaps Google found through robots.txt, though you can submit those as well to track them. Submitting needs owner permission; without it, reference the sitemap in robots.txt.
“Discovered pages” is the number of URLs Google read from the file, not the number it indexed. Google states plainly that a URL in a sitemap may never be crawled or indexed. To see how many made it, filter the Page indexing report by that sitemap. If a fetch keeps failing, Google retries for a few days and then stops, so a broken sitemap needs a fix and a resubmission.
Core Web Vitals report
The Core Web Vitals report uses field data from the Chrome UX Report: real visits, not a lab test. Similar URLs are grouped, and each group takes the status of its worst metric, separately for mobile and desktop. A group needs enough data for both LCP and CLS to appear at all, so low-traffic sites often see “No data available”.
| Metric | Good | Need improvement | Poor |
|---|---|---|---|
| LCP (loading) | ≤ 2.5 s | ≤ 4 s | > 4 s |
| INP (responsiveness) | ≤ 200 ms | ≤ 500 ms | > 500 ms |
| CLS (visual stability) | ≤ 0.1 | ≤ 0.25 | > 0.25 |
According to Google’s Core Web Vitals report documentation, group values are the 75th percentile of visits over the last 28 days, which is why a fix takes weeks to show. PageSpeed Insights, linked from each example URL, reports on single URLs and may not match the group. Once you’ve fixed an issue, Start Tracking runs a 28-day monitoring session. Because groups are built from similar pages, fix the template rather than a single URL.
Links report
The Links report shows your top linked pages from other sites, the top linking sites, the most common link text, and the pages linked most from within your own site. Read it as a sample, not an inventory. The Links report documentation says it isn’t a complete list, tables stop at 1,000 rows, data is grouped by canonical URL and by root domain, the report doesn’t say which links are nofollow, and it includes links found over time that may since have been removed. So its counts won’t match third-party backlink tools.
The internal links table is the more actionable half. If your most important pages aren’t near the top of the internal “Top linked pages” list, your navigation and in-content links aren’t pointing where your priorities are.
Crawl stats, robots.txt and the Settings reports
The reports under Settings matter mostly for technical work:
- Crawl stats shows Googlebot’s requests over time, by response code, file type and purpose, plus host status for the last 90 days. It counts the URLs actually requested, each redirect hop separately, rather than canonicals. It’s available only for Domain and root-level URL-prefix properties, and Google says sites under about a thousand pages generally don’t need it. If it shows lots of parameter, redirect or 404 requests, here’s what wastes crawl budget on large sites.
- robots.txt report shows whether Google could fetch and parse your robots.txt files.
- Bulk data export schedules a daily export of performance data to BigQuery.
- Users and permissions, Ownership verification and Associations (for linking Google Analytics and other services) are covered in the setup guide linked above.
Outside Settings, check Manual actions and Security issues whenever the Overview page flags them, and the rich result status reports if you use structured data. One 2026 change to note: FAQ rich results stopped appearing in Google Search on May 7, 2026, and Google has since removed the FAQ rich result documentation, so FAQ markup is no longer a rich result opportunity.
A 15-Minute Weekly Search Console Routine
- Overview: look for manual actions, security issues and sudden dips in clicks.
- Insights, then Performance: compare the last 28 days with the previous period and sort pages and queries by the Difference column.
- Generative AI report: note which pages gained or lost impressions in AI Overviews and AI Mode.
- Page indexing: filter to your main sitemap, confirm your important URLs are still indexed and open any new not-indexed reason.
- URL Inspection: inspect anything you published or significantly changed this week.
- Annotate the Performance chart with releases and fixes.
Once a month, add Core Web Vitals, Links and Crawl stats. For how these checks fit into a wider SEO program, see Skribra’s SEO guide.
Frequently Asked Questions
- How long does Google Search Console take to show data?
- Performance data is usually available within two to three days. The newest data is marked as preliminary, shown as a dotted line, because it can still change. The 24-hour view shows hourly data that is partly preliminary. A new property can take a few days to show anything, and Core Web Vitals stays empty until there is enough Chrome field data.
- Why don't Search Console clicks match Google Analytics?
- They measure different things. Search Console counts clicks on Google's results, while Analytics counts sessions on your site. Google cites privacy filtering, data processing, a two-to-three-day lag, Pacific Time reporting days and JavaScript-only tracking in Analytics as the main causes. Compare trends over the same dates rather than totals.
- How far back does Search Console data go?
- The Performance reports keep 16 months of data. To keep a longer history, export it regularly through the Search Analytics API or set up the bulk data export to BigQuery, which writes daily data to your own project.
- Does Search Console show AI Overviews and AI Mode traffic?
- Yes. Impressions and clicks from AI Overviews and AI Mode are included in the Web search type of the Performance report. A dedicated generative AI performance report, available to all sites since August 31, 2026, isolates AI-feature impressions by page, country, device and date. As of October 2026 it shows impressions only, not clicks.
- Do I need the Page indexing report for a small site?
- Often not. Google says sites with fewer than 500 pages can usually check indexing with a site: search and URL Inspection on their key pages instead. The report becomes useful when you have many URLs, templates that generate duplicates, or a sudden drop in indexed pages.
See Search Console Data for Every Article
Skribra connects to Google Search Console and shows clicks, impressions, CTR, average position and indexing status for each article it publishes, with up to 16 months of history. Its Hook agent rewrites titles and meta descriptions on pages with high impressions and low CTR, and leaves pages already earning healthy traffic alone.
Plans start at $19/month, and every plan comes with a 3-day free trial. The $75/month Pro plan is the one that runs all five maintenance agents on every article.
Written by
Skribra
This article was crafted with AI-powered content generation. Skribra creates SEO-optimized articles that rank.
Share: